

Measuring clinical performance is challenging. Some patients are older or sicker; some have more advanced clinical conditions. Measurement populations are rarely large enough to eliminate chance. To accurately measure clinical performance, you need to control for these confounders and mitigate the role of chance. You need accurate measurement of outcomes, processes, and costs to meaningfully improve the quality and efficiency of care delivery. You also need to be able to compare the performance of different providers to one another and track changes over time.
To that effect, there are three key technologies that are essential to success in measuring and improving performance in healthcare: risk adjustment, reliability adjustment, and on-demand performance feedback.
In this post we will cover:
- Risk and Reliability Adjustment in Healthcare: The Basics
- Risk Adjustment Methods
- Reliability Adjustment Methods
- On-Demand Performance Feedback
Risk and Reliability Adjustment: The Basics
Let’s start out with a simple equation:
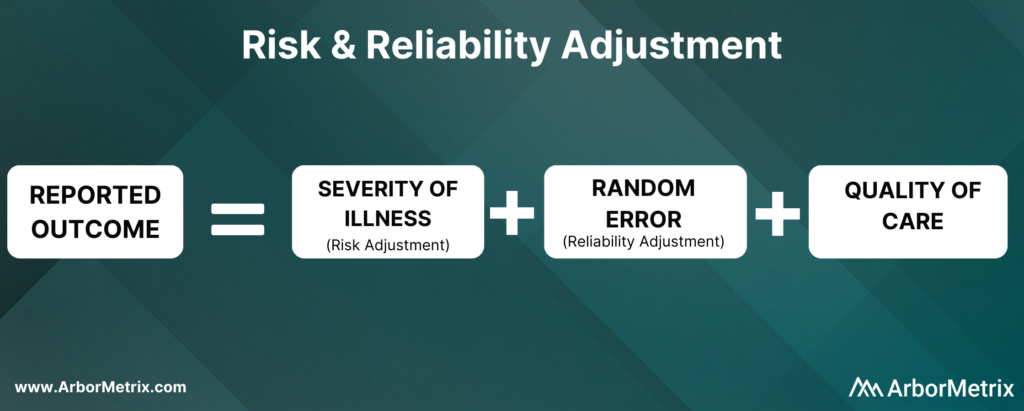
Now, let’s break this equation down and define each component.
What Is Risk Adjustment?
Risk adjustment is a process that corrects for the severity of a patient’s illness. In other words, adjusting for risk levels the playing field and ensures that comparisons of hospitals and clinicians are fair and accurate.
Why Is Risk Adjustment Important?
Some hospitals and clinicians treat more high-risk patients than others. Because of that, comparing a metric like mortality rates between two different hospitals isn’t always helpful, because one hospital is working with much more severely ill patients than the other.
In short, it’s challenging to compare outcomes like complications, utilization, and mortality rates for patients with the same condition but different health statuses.
That’s where risk adjustment comes in. Risk adjustment uses statistical models to account for clinical risk factors that differ between patients. For example, an 85-year-old female undergoing cardiac surgery is more likely to suffer adverse outcomes compared to an otherwise healthy 50-year-old male undergoing the same procedure. Comparing the two patients as if they had the same level of risk would be misleading.
We have developed our own risk adjustment methodology, which we’ll discuss in more detail in the next section. In short, we run data through scientifically and clinically validated statistical models that explicitly evaluate all patient factors that may be related to each adverse outcome. Our modeling approach adheres to all of the best practices in risk adjustment, but with significantly improved efficiency.
Reliability adjustment is a statistical technique based on hierarchical modeling that was pioneered by the ArborMetrix founders [1] and is designed to isolate the signal and reduce the noise in large datasets.
When sample sizes for a hospital or clinician are small, it can be difficult to determine if outcomes such as mortality are due to chance or to true differences in quality. Traditional analytical methods often report outcome numbers that are misleading, because clinicians and hospitals can’t determine whether they are truly different from the average.
Additionally, statistical measures like confidence intervals and p-values are often misunderstood, ignored, or relegated to a footnote. This lack of accuracy can lead to care teams addressing problem areas that are, in reality, not problematic — leading to loss of time, effort, and expense.
To optimize the effort of quality improvement work, we provide reliability adjustment in addition to risk adjustment.
Together, these methodologies ensure patient outcomes and other performance metrics are reported accurately and with enough actionable clinical detail to effectively inform improvement efforts. Importantly, these methodologies are essential to building trust in the data.
Next, we’ll take a closer look at the methods used in both types of techniques, starting with risk adjustment.
Risk Adjustment Methods
ArborMetrix has developed a unique, best-in-practice risk adjustment methodology to significantly enhance analytic efficiency. In our methodology, registry data is run through scientifically and clinically validated statistical models that evaluate all patient factors that may be related to each outcome.
Additionally, we have introduced several innovations into our technology, such as real-time model recalibration, that automate the risk-adjustment process and ensure models are well-fit to changing data.
Let’s dive a bit deeper and explore the steps involved in developing a risk model.
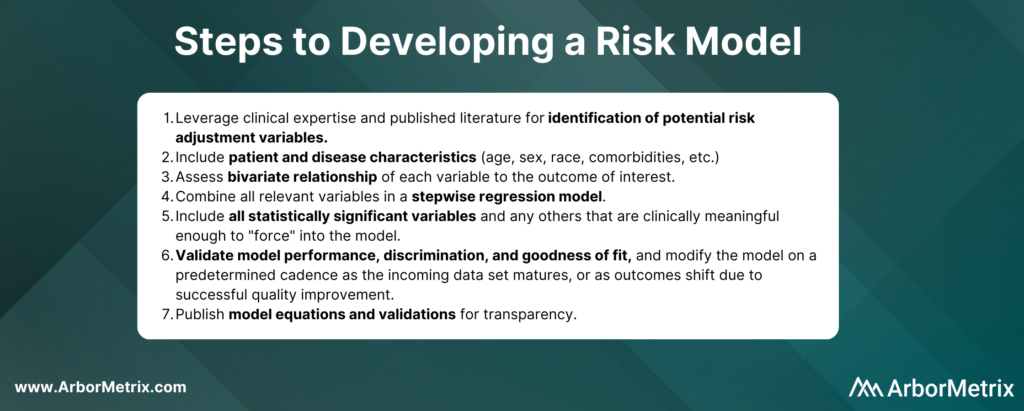
In practice, the specific risk factors included in the model will vary by outcome and by the patient populations included in the denominator for the measure. For example, some of the most important comorbidities in a risk model for serious complications of colectomy surgery include factors such as anemia, renal failure, and weight loss.
Risk adjustment corrects for the individual severity of patient illness within a dataset. With our highly efficient methodology, you can be sure that comparisons between clinicians, hospitals, or regions are accurate.
Reliability Adjustment Methods
Pioneered by our founders, reliability adjustment is a statistical technique based on hierarchical modeling that is designed to isolate the signal and reduce the noise in your dataset.
More specifically, when sample sizes for a hospital or clinician are small, the observed rates or rare outcomes may be due to chance and should be considered less precise than rates based on larger sample sizes.
What Is Reliability Adjustment?
Reliability is a measure of this imprecision, where a value of “0” means the outcome is 100% noise (completely unreliable) and a value of “1” means the outcome is 100% signal (perfectly reliable). In practice, most outcomes have reliability between 0 and 1.
Why Is Reliability Adjustment Important?
Reliability adjustment is important in certain circumstances because small sample sizes or rare outcomes create uncertainty for a hospital or clinician around whether differences in outcomes such as mortality were due to chance or true differences in quality.
For example, a hospital with a mortality rate of 50% because 1 patient died in a total of 2 cases should be interpreted very differently than if 100 out of 200 patients died. For most surgical procedures, they would need to have its mortality rate reliability-adjusted to account for the prediction that if they had 200 cases instead of 2, it would be very unlikely that their mortality rate would still be 50%.
We work with our registry partners through a methodical planning process to develop and refine clinically relevant and scientifically accurate reliability models.
Without reliability adjustment, traditional analytical methods often report outcome numbers that are misleading to clinicians and hospitals, who cannot sort out whether their performance rates are truly different from the average. Reliability adjustment helps clinicians and hospitals identify real problem areas and focus improvement activities where the greatest improvement opportunity exists.
In short, reliability adjustment corrects for random error, allowing you to trust that the analytic insights you’re generating are as accurate as possible.
MSQC Relies on Risk and Reliability Adjustment to Improve Performance
The Michigan Surgical Quality Collaborative (MSQC) is a national leader in surgical quality improvement. They help surgeons improve at the individual level by providing surgeon-specific reports to aid in performance self-assessment.
Risk adjustment is crucial to the hospital-to-hospital comparisons done routinely by MSQC, and the risk adjustment modeling and reporting development represent a combined effort between the MSQC analytic team and ArborMetrix. After the process of risk adjustment, the outcomes data is also reliability adjusted.
MSQC’s real-time, risk- and reliability-adjusted reports offer a look at each surgeon’s individual outcomes data, with a detailed drill-down on patient-level data included in the analysis. Surgeons can view their performance relative to their hospital or to the collaborative as a whole. Surgeons can also view their performance in comparison to other contributing surgeons, both within their institution and beyond, in a de-identified manner, providing even more valuable information to help surgeons identify areas for quality improvement.
MSQC is a top example of a clinical registry program that is achieving real-world quality improvement. Its members have collectively achieved outstanding results and greatly enhanced care for their patients. A few highlights include:
• 34% reduction in surgical site infection rates for colectomy procedures.
• 50% reduction in patient opioid consumption across 9 surgical procedures, with no changes to patient-reported satisfaction.
• 40% reduction in morbidity and mortality of non-trauma operations.
• Regularly published research in leading academic journals.
On-Demand Performance Feedback Makes Rapid Healthcare Improvements Possible
Having access to accurate, trusted analytical insights is helpful. Being able to act on those insights as quickly as possible is even better. That’s where on-demand performance feedback comes in.
ArborMetrix’s products deploy rigorous analytics, grounded in scientific best practices, allowing users to quickly and easily measure performance and understand their clinical outcomes and business. Our unique technology allows for reporting and the application of data science in real-time. This gives physicians access to up-to-date risk- and reliability-adjusted reporting, which builds trust and enables rapid-cycle improvements.
Traditional processes for producing reports with risk- and reliability-adjusted measures can take months using manual methods performed by statisticians. As a result, reports on comparative outcomes have traditionally been delivered in static formats that reflect old, stale data that may no longer be useful for quality improvement efforts.
With the interactive ArborMetrix platform, end-users can select different levels of aggregation, patient populations, and time periods to see dynamic risk- and reliability-adjusted reports that reflect the most up-to-date data. The combination of fresh data and flexible exploration of outcomes information means you can get useful feedback quickly.
Work With Data You and Others Can Trust
Together, risk adjustment, reliability adjustment, and on-demand performance feedback build trust in the data, which trickles down to trust in the evidence, trust in the insights, and trust in the conclusions drawn from the data. Further, having access to all of this information in real-time ensures that quality improvement efforts won’t go to waste.