The Basics of Clinical Quality Measures (CQMs) for Registries

In this series on quality measurement, we will discover and discuss measure development from definition to implementation and discover why quality measures are so impactful for clinical data registries.
Quality means that care delivered has value: It is safe, effective, focused on the patient, timely, and equitable. That’s why quality measures are so important.
Quality measurement is a major component of measurement science and healthcare quality – especially in clinical registries. These methodologies are responsible for the creation and implementation of performance metrics, development of testing methods, and other quality-promoting activities. [1]
In this post we will cover:
- What Is a Clinical Quality Measure (CQM)?
- Why Quality Measurement?
- Types of Quality Measures
- The Evolution of Quality Measures
- What Role Do Registries Play in Quality Measurement?
What Is a Clinical Quality Measure (CQM)?
Quality measures are defined as metrics that quantify healthcare processes, outcomes, patient perceptions, and organizational systems related to high-quality healthcare.
The structure for measurement was created in what is known as the Donabedian model, a conceptual model that provides the framework for evaluating quality in the healthcare setting. [2]
To achieve the ends of quality improvement, quality measures must help evaluate whether a metric meets certain healthcare quality criteria defined in the Institute of Medicine’s six domains [3]:
- Effectiveness: Relates to providing care processes and achieving outcomes as supported by scientific evidence.
- Efficiency: Relates to maximizing the quality of a comparable unit of health care delivered or unit of health benefit achieved for a given unit of health care resources used.
- Equity: Relates to providing health care of equal quality to those who may differ in personal characteristics other than their clinical condition or preferences for care.
- Patient centeredness: Relates to meeting patients’ needs and preferences and providing education and support.
- Safety: Relates to actual or potential bodily harm.
- Timeliness: Relates to obtaining needed care while minimizing delays.
Why Quality Measurement?
Without quality measurement, it is difficult to ascertain whether processes and interventions intended to improve health are effective, safe, efficient, equitable, or timely.
Quality measures provide an objective way to quantify adequacy and appropriateness of care while identifying strengths and weaknesses of a healthcare system.
We also use measures not only to improve the quality of care and reduce cost, but also to minimize disparities in care.
Types of Quality Measures
The Centers for Medicare and Medicaid Services (CMS) has outlined a blueprint for quality measurement. This is intended to walk measure developers through the process of creating and maintaining quality measures.
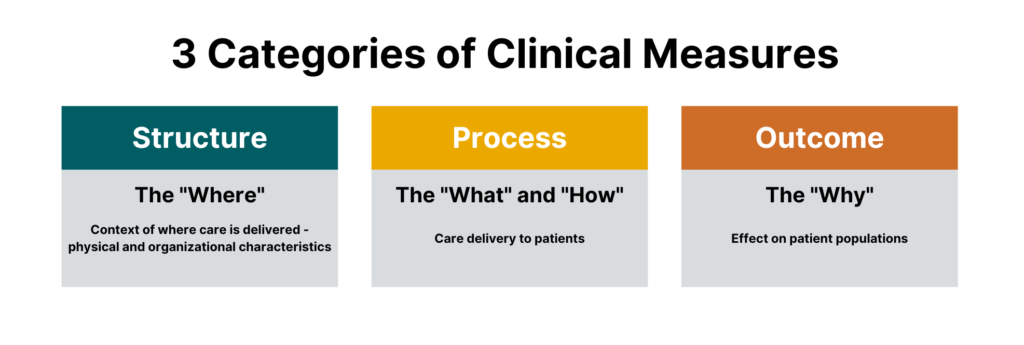
While there are many different sub-types of measures, measures generally fall under three categories:
- Process measures
- Structural measures
- Outcome measures
 One could argue that there is a fourth major category that falls outside of the Donabedian model, which are balance measures — metrics that ensure improvements to one part of the system are not having an adverse impact in other areas.
All are crucial for quality healthcare delivery, and all are part of today’s most impactful clinical registries.
Process Measures
Process measures are the most common type of quality measures. They evaluate transactions between patients and providers. Process measures represent specific steps taken to achieve a positive improvement or the reduction of a harmful outcome.
Examples of process measures include measuring the percentage of women who have had mammograms or the percentage of patients who had their hemoglobin A1C checked for diabetes control.
Structural Measures
Structural measures assess the context in which healthcare is delivered and evaluate the quality of the healthcare setting. An example of a structural measure is whether a practice uses Certified EHR Technology or whether they use e-prescribing to send patient prescriptions to pharmacies.
Outcome Measures
While they are the hardest to evaluate, outcome measures are arguably the most valid since they assess the effectiveness of healthcare on patient populations.
Determining the root causes of an outcome in a healthcare setting can be challenging because many factors other than medical intervention can influence a particular outcome. [2] Hence, outcome measures should be seen as a way of indirectly assessing the quality of care and should be evaluated in the context of the processes and structure that produce the outcome.
An example of an outcome measure is the Hospital-Wide, 30-Day, All-Cause Unplanned Readmission (HWR) Rate for the Merit-Based Incentive Payment Program (MIPS) Groups. This population health outcome measure serves as the attribution metric for clinicians in MIPS and assesses the readmission rate of patients within five specialty cohorts.
The Evolution of Quality Measures
While all quality measures generally have the same makeup, the data sources and administration of quality measures can differ.
Historically, all quality measures were collected in a manual form, but some modern measures can be calculated solely through the use of electronic data from the electronic health record (EHR). These are known as electronic clinical quality measures (eCQMs).
Clinical Quality Measures (CQMs)
Clinical quality measures use a variety of data sources including the electronic health record, but most often include manual chart abstraction. This requires measure flows to aid an abstractor in finding data for the measure in different areas. Clinical quality measures can use a wide variety of data and sources but require the most human intervention in collection and reporting.
Electronic Clinical Quality Measures (eCQMs)
Electronic clinical quality measures (eCQMs) are tools that help measure and track quality-of- care services that clinicians and hospitals provide using structured data produced by a provider’s EHR. Using eCQMs helps to reduce error, cost, clinician burden, and helps to promote efficient and effective care.
However, eCQMs are constrained to data stored in the EHR, which limits utility. While the number of eCQMs currently available are limited, the move to include more structured data in electronic health records and the mandate from CMS to move to digital measures will cause growth in this area. [4]
What Role Do Registries Play in Quality Measurement?
Quality measures are collected through many means, including administrative claims, assessments, chart abstraction, and registries.
As a repository for clinical data and an engine to calculate outcomes, registries are integral in the function of many quality and accountability programs including the CMS QPP and the NCQA HEDIS program.
Quality measures are the first tool in your quality improvement arsenal and the registry can provide insights on whether healthcare processes, products, treatments, therapies, and practitioners are performing well.
Quality measures are the cornerstones of many quality programs including regulatory reporting, performance improvement, and registry program management. These metrics provide objective approaches to data collection, healthcare benchmarking, and outcomes reporting.
In our next blog in this two-part series, we will dive into the creation of quality measures, pitfalls to avoid, and resources to help you be successful.

The Value of Registries in Post-Market Surveillance

Clinical data registries are useful across many parts of healthcare. One of their most valuable purposes is post-market surveillance.
Registries are designed to collect, analyze, and interpret large amounts of real-world data setting the foundation for successful post-market surveillance. When registries are built well, the result is a vast data resource that provides real-time, ongoing data collection, and is a central source of truth to answer key questions like:
- How is a device or drug actually used in real-world settings?
- What does the typical target patient look like?
- How does a product truly perform for the target patient population versus sub-populations that differ by age, gender, race/ ethnicity, geography and combination of comorbidities?
Let’s dig into how registries are used in post-market surveillance, starting with some key definitions.
In this post we will cover:
- What Is Post-Market Surveillance?
- What Are the Goals of Post-Market Surveillance?
- What Is the Value of Post-Market Surveillance?
- How Do You Conduct Post-Market Surveillance?
- How Do Clinical Registries Drive Post-Market Surveillance?
What Is Post-Market Surveillance?
Post-market surveillance (also called post-marketing surveillance) demonstrates the real-world safety and effectiveness of medical devices and pharmaceuticals.
The U.S. Food and Drug Administration (U.S. FDA) defines it as “the active, systematic, scientifically valid collection, analysis, and interpretation of data or other information about a marketed device.” [1]
This definition underscores that post-market surveillance is an active, ongoing process – not a one-off. It also emphasizes data science as a critical part.
The European Medical Device Regulation (E.U. MDR) defines it as “all activities carried out by manufacturers in cooperation with other economic operators to institute and keep up to date a systematic procedure to proactively collect and review experience gained from devices they place on the market, make available on the market or put into service for the purpose of identifying any need to immediately apply any necessary corrective or preventive actions.”
Similar to the U.S. FDA, the EU MDR also highlights the need for a post-market surveillance system that provides up-to-date insights. But it goes a step further to call out the importance of using those insights to make adjustments and improvements.
What Are the Goals of Post-Market Surveillance?
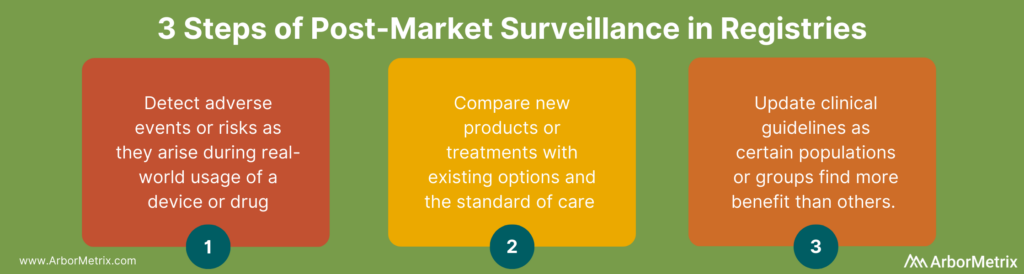
Pharma and medical device companies rely on the real-world insights they gain through post-market surveillance activities to:
- Detect adverse events or risks as they arise during real-world usage of a device or drug.
- Compare new products or treatments with existing options and the standard of care.
- Update clinical guidelines as certain populations or groups find more benefit than others.
- Comply with regulatory requirements.
There are many different aspects of a device or product that are assessed in post-market surveillance. A few examples include:
- Clinical effectiveness: Use data from real-world clinical settings to examine the relative effectiveness of a device or drug in a large, diverse patient group to compare that product to the standard of care or competition.
- Adverse events and side effects: Leverage real-world evidence to identify risks or adverse reactions that might have been missed in the initial clinical trial for a device or drug.
- Utilization: Examine how a product is actually used in the real world, which can be different than what is approved or marketed.
What Is the Value of Post-Market Surveillance?
Real-world evidence delivered through post-market surveillance offers differing importance for different stakeholders.
For medical device companies and pharmaceutical companies, post-market surveillance can provide additional information on the natural history of disease and the relative performance of their product to the disease, as well as other marketed products. The veracity of evidence acquired through an appropriately designed registry or post-market surveillance program enables the sponsoring company to then tweak clinical, marketing and pricing strategies accordingly to develop new and improved patient-centric products.
For clinicians and provider organizations, post-market surveillance can provide information on how products perform relative to others in the context of real-world patient populations, which are often materially different from clinical trial populations. This can then inform treatment decisions, including off-label use of products.
For payers and regulatory agencies, post-market surveillance can shed light on which products and drugs are the safest and most cost-effective. This can then inform coverage and reimbursement decisions.
How Do You Conduct Post-Market Surveillance?
Let’s break down the U.S. FDA’s definition of post-market surveillance into three components:
- Data Collection
- Data Analysis
- Data Interpretation
These are the steps to conducting post-market surveillance for medical devices and drugs.
Step 1: Data Collection for Post-Marketing Surveillance
You need the right data sources and the right technology to collect real-world data efficiently, securely, and accurately for post-market surveillance activities.
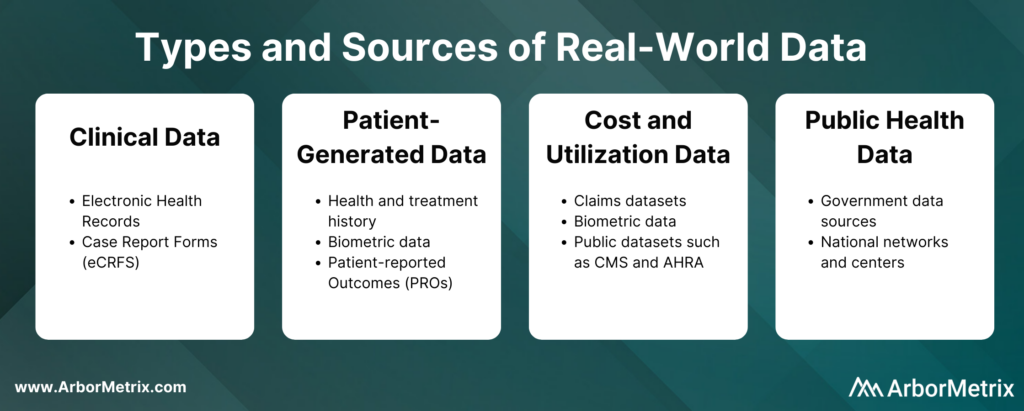
These real-world data can come from several sources, such as:
- Clinical data from electronic health records (EHRs) and case report forms (eCRFs)
- Patient-generated data from patient-reported outcome (PRO) surveys
- Cost and utilization data from claims and public datasets
- Public health data from various government data sources
These real-world data are collected in two primary ways:
- Machine-to-machine data connection allows you to securely and efficiently collect real-time data from any number of systems, including electronic health records and administrative claims.
- Human-to-machine data collection allows you to capture essential care details and specialized information with electronic case report forms. It also allows you to collect patient-reported outcomes (PROs) or gain insights directly from patients, clinicians, and others through web-based surveys.
The technology you use to get this data matters. You need an efficient and secure way to collect large amounts of real-world data and prepare it for analysis.
Step 2: Data Analysis for Post-Marketing Surveillance
Once you collect data for a given device or product, the next step is transforming it into real-world evidence. This involves combining, blending, validating, and analyzing various data sources. These analyses can be risk- and reliability-adjusted according to the data ingested, and then presented to stakeholders in an interactive and engaging way.
Step 3: Data Interpretation for Post-Marketing Surveillance
Once you are finished collecting and analyzing data, you need a way to interpret the data easily and readily. Here are a few things to keep in mind:
- To ensure timely and accurate interpretation of data, you need statistically-adjusted reports that are available in real-time. This helps you quickly and easily measure and understand clinical outcomes, determine patient quality of life, and understand the total financial impact of the intervention.
- Statistically-adjusted reports should be built using key risk and reliability adjustment methodologies that are essential to success in maximizing data value.
How Do Clinical Registries Drive and Use Post-Market Surveillance?
Clinical data registries are uniquely useful in their ability to facilitate post-market surveillance for three reasons.
- They advance post-market surveillance activities to help us better understand the real-world safety and effectiveness of procedures, treatments, and devices.
- They solve complex problems for device and pharma companies. These organizations in general are faced with complex barriers when seeking real-world data for purposes of research and development, quality improvement, or regulatory requirements.
- They deliver the comprehensive technology needed to build a registry that collects real-world data, transforms it into real-world evidence, and makes it accessible and useful for decision making.
There are a few ways medical device and pharmaceutical companies are using registries to support their post-market surveillance programs.
- Accessing data from an existing registry.
- Partnering with an existing registry that is running registry-based clinical trials.
- Leveraging registry technology to support a registry-based study.
- Creating new registries and using existing registry data to support a full post-market surveillance program.
Industry-Leading Registry Technology for Post-Market Surveillance
As medical technology and research continues to advance, the importance of tracking and reacting to real-world evidence through post-market surveillance will only continue to grow. Registries will play an integral part in this process, and their analytic potential will serve as an essential asset for patients, providers, and industry partners alike.
ArborMetrix offers an industry-leading, proven registry solution for post-market surveillance that meets the needs of medical device manufacturers, pharmaceutical companies, medical specialty societies, and clinicians.

9 Ways Real-World Evidence is Changing Healthcare

Real-world evidence, or RWE, is fundamentally changing the future of healthcare. Here’s how it happens:
- Real-world data (RWD) is aggregated and transformed into RWE through robust analytics.
- Real-world evidence (RWE) provides clinically-rich insights into what actually happens in everyday practice and why.
- Stakeholders across the healthcare ecosystem use this new knowledge to support decision-making and improve safety and effectiveness, and ultimately, patient outcomes.
Let’s take a closer look at RWD, how it becomes RWE, and the value of RWE across the healthcare ecosystem delivered through nine use cases.
In this post we will cover:
- What Is Real-World Data (RWD)?
- What Is Real-World Evidence (RWE)?
- Why Do We Need Real-World Evidence?
- Use of Real-World Evidence in Pharmaceutical and Device Companies
- Use of Real-World Evidence Among Regulators
- Use of Real-World Evidence Among Clinicians and Academic Researchers
- Use of Real-World Evidence in Healthcare Systems
- The Role of Registries in Generating Real-World Evidence
What Is Real-World Data (RWD)?
In order to understand real-world evidence and its role in healthcare, we must first define real-world data, or RWD.
Real-world data is any data that is collected in the context of the routine delivery of care, as opposed to data collected within a clinical trial where study design controls variability in ways that are not representative of real-world care and outcomes.
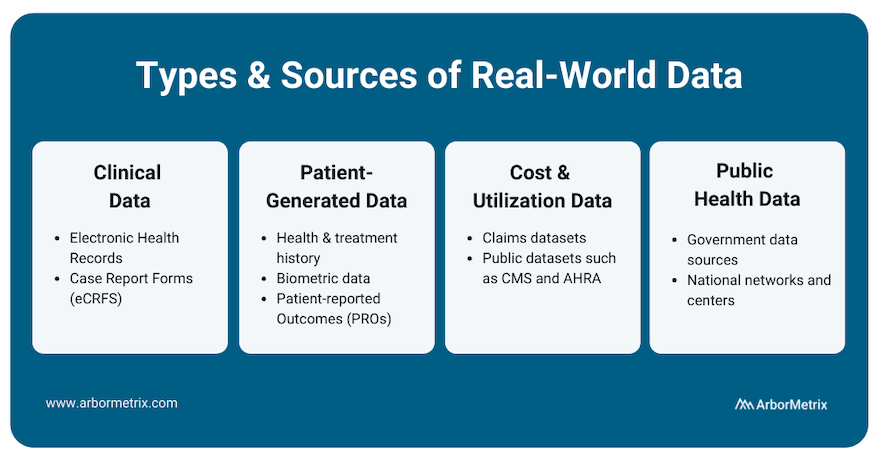
There are many different types and sources of RWD. Let’s take a closer look at each type, its source, and its uses.
- Clinical data from electronic health records (EHRs) and case report forms (eCRFs). This data provide patient demographics, family history, comorbidities, procedure and treatment history, and outcomes.
- Patient-generated data from patient-reported outcome (PRO) surveys. These data provide insights directly from the patient, and they help researchers understand what happens outside of clinic visits, procedures, and hospital stays.
- Cost and utilization data from claims and public datasets. They provide information regarding healthcare services utilization, population coverage, and prescribing patterns.
- Public health data from various government data sources. These add critical information to enable stakeholders to best serve the needs of the populations they serve.
What Is Real-World Evidence (RWE)?
The U.S. Food and Drug Administration (FDA) defines RWE as “the clinical evidence regarding the usage and potential benefits or risks of a medical product derived from analysis of real-world data." [1]
Unlike traditional clinical trials, where necessary data elements can be curated and collection mandated, the creation of RWE requires assessing, validating and aggregating various, often disparate, sources of data available through routine clinical practice.
The creation of RWE requires a combination of high-powered analytics, a validated approach and a robust knowledge of available RWD sources (e.g. what data is captured within existing quality registries, what data can be captured through an EHR or claims, which patient organizations capture data on relevant patient cohorts).
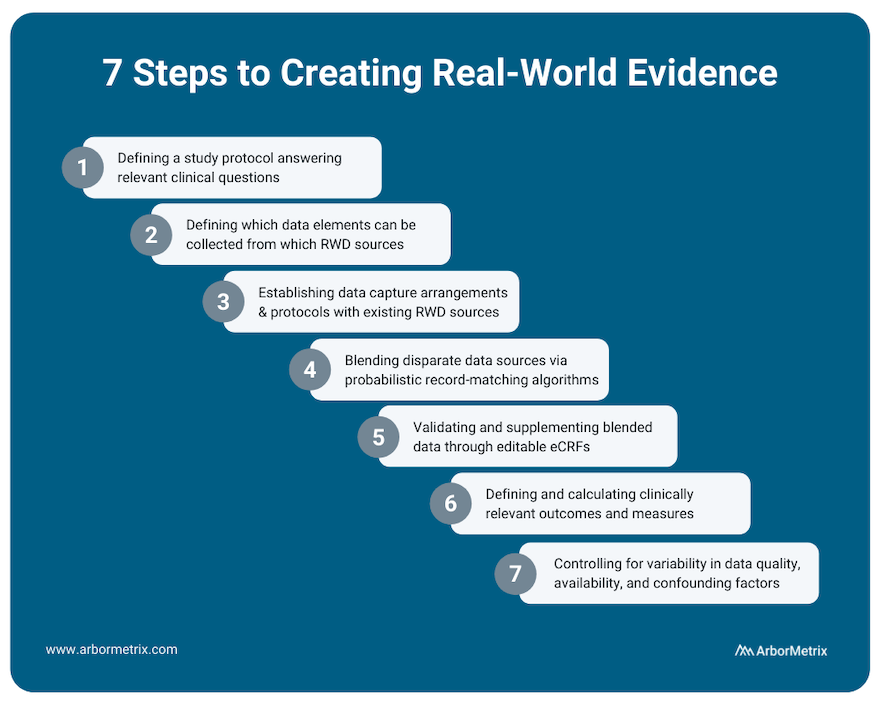
This process includes several steps:
- Defining a study protocol answering relevant clinical questions.
- Defining which data elements can be collected from which RWD sources.
- Establishing data capture arrangements and protocols with existing RWD sources.
- Blending disparate data sources through probabilistic record matching algorithms.
- Validating and supplementing blended data through editable eCRFs.
- Defining and calculating clinically relevant outcomes and measures.
- Appropriately assessing and controlling for variability in data quality, availability and confounding patient factors affecting measured outcomes.
RWE can provide a holistic view of patients that in many cases cannot be studied through traditional clinical trials.
Why Do We Need Real-World Evidence?
There’s a gap between research (what we learn) and everyday practice (what we do) in healthcare, and it creates a difference between what is expected to happen and what really happens.
But it’s what really happens that matters. Driving measurable improvements in healthcare requires us all to be rooted in the reality of what actually happens before, during, and after clinical procedures, interventions, and office visits.
RWE is here to fill those gaps and root us in truth. It tells us what really happens when doctors treat a wide range of patients that don’t look like the homogeneous patient groups in a clinical trial.
Because of this, RWE serves many uses and provides many benefits across the healthcare ecosystem.
Uses of Real-World Evidence in Pharmaceutical and Device Companies
Pharmaceutical and medical device companies are major consumers of RWE, as it can provide value across the entire product lifecycle.
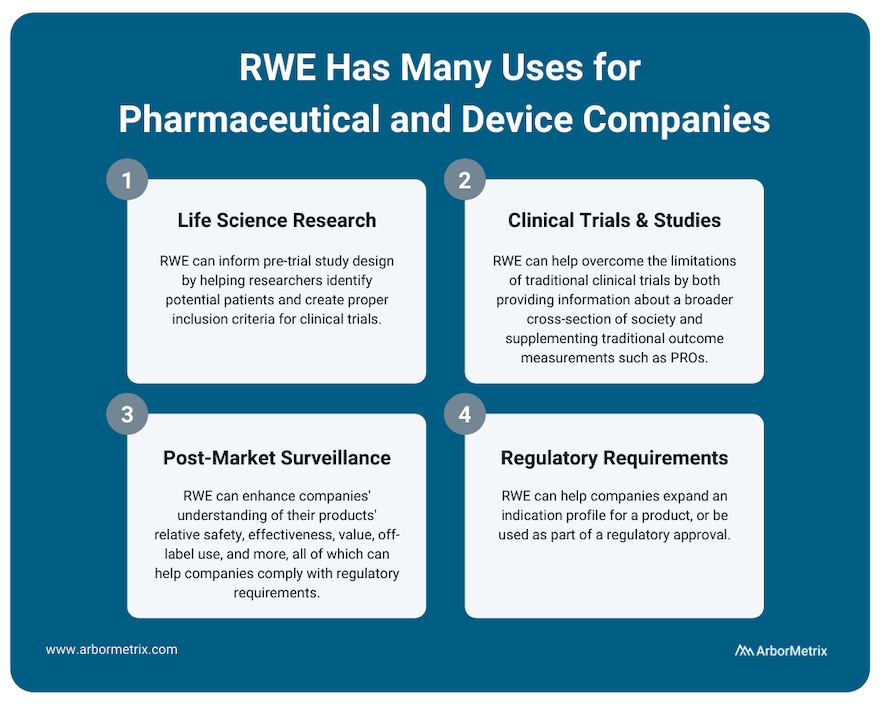
Use Case #1: RWE and Life Science Research (Pre-Trial Design)
RWE plays an important role for research across the product lifecycle for both pharmaceutical and device companies. It can inform pre-trial study design by helping researchers identify potential patients and create proper inclusion criteria for clinical trials.
Use Case #2: RWE and Clinical Studies and Trials
Much of medical innovation is driven by traditional clinical trials, where new pharmaceuticals and devices are rigorously studied and tracked before they can be sold and widely distributed. Although clinical trials are incredibly important to determine the safety and efficacy of new technologies, when compared to real-world evidence they do have some limitations.
For example:
- Traditional clinical trials can have strict inclusion criteria that makes it challenging for providers to accurately extrapolate the results of a clinical trial to a broader population.
- Clinical trial participation is often limited by who the study administrators are able to recruit, and various demographics are often not able to participate. This again challenges the generalizability of clinical trial results across patient populations.
Real-world evidence can help overcome the limitations of clinical trials by providing information about a broader cross-section of society. This can help clinicians, researchers, and industry partners better understand their products and how they work.
Also, during clinical trials, RWE can supplement traditional outcome measurements with patient-generated data such as patient-reported outcomes (PROs) or biometric data that is easier to collect between doctor appointments.
Use Case #3: RWE and Post-Market Surveillance
Once a product is approved and marketed, RWE can help a pharmaceutical or medical device company understand their products’ relative safety, effectiveness, value, off-label use and more. This post-market surveillance, or post-marketing surveillance, is valuable to stakeholders across healthcare. For example, we support several clinical data registries that provide real-time RWE that device manufacturers use to evaluate their products.
Purposes of this post-market surveillance may include:
- Detecting adverse events or risks as they arise during real-world usage of a device or drug.
- Comparing new products or treatments with existing options and the standard of care.
- Updating clinical guidelines as certain populations or groups find more benefit than others.
- Complying with regulatory requirements.
Use Case #4: RWE and Regulatory Requirements
RWE can help companies expand an indication profile for a product. For example, while it may not be feasible to perform a full clinical trial for a product that is commonly used for off-label indications, by collecting RWD from disease or product registries, companies may be able to study safety and outcomes data for their product or device, which can then be used to supplement a submission to the U.S. FDA or European Medicines Agency (EMA).
In addition, the U.S. FDA has indicated that for certain products, a promise of RWE analysis in the post-market period can be used as part of a regulatory approval. For example, it might not be feasible to run a clinical trial on a product that is to be implanted for a long period of time. In a case like this, post-market RWE can help provide that missing long-term data.
Uses of Real-World Evidence Among Regulators
Regulatory bodies like the U.S. FDA and the EMA are increasingly using real-world evidence, and in some cases requiring it, to satisfy post-market approvals.
Use Case #5: RWE and Post-Market Approvals
The U.S. FDA has provided a framework that provides insight and instruction on how to utilize RWE to support a new drug or device regulatory filing. [2]
They specifically note a few use cases where RWD and RWE can be utilized:
- Expanded label indications for a product or device.
- Post-market surveillance studies.
- Post-approval device surveillance as a condition of approval.
- Control groups for certain clinical studies.
- Supplementary data to help understand clinical trial data.
- Objective performance criteria and performance goals.
Uses of Real-World Evidence Among Clinicians and Academic Researchers
Use Case #6: RWE and Decision Support Tools
Through advanced analytics, RWE can provide individualized decision support tools that can facilitate shared decision-making between a patient and physician. For example, the Michigan Bariatric Surgery Collaborative uses a tool that predicts, based on individual characteristics, how a patient might respond to different types of bariatric surgery.
Use Case #7: RWE and Guideline Development
Through comparing outcomes for different treatment options, it might become evident that particular drugs or dosages are better optimized for different individuals, and treatment guidelines can be refined and optimized accordingly.
Use Case #8: RWE and Clinical Research
With large real-world datasets, researchers can perform observational, retrospective, and prospective studies that help academia advance its understanding of current therapies and technologies. Check out this list of research publications that use RWE from clinical registries to advance knowledge.
Uses of Real-World Evidence in Healthcare Systems
Use Case #9: Quality Measurement, Benchmarking, and Improvement
RWE can track outcome and quality measures across organizations. For administrators, RWE can provide information about how their entire health system is performing relative to others, and how their individual physicians are benchmarking relative to peers. This information can help inform coverage discussions with payers, and refine quality-based reimbursement strategies that reward solid outcomes.
The Role of Registries in Generating Real-World Evidence
Clinical registries, including patient, product and claims registries, not only provide a rich source of RWD. They are also critical tools for generating RWE itself and using RWE to support post-market surveillance and research.

What is Healthcare Benchmarking?

Striving to improve is always a worthwhile pursuit, but measuring your own improvement is only one piece of the healthcare quality puzzle. To see the full picture of the effectiveness of your efforts, you need to understand how you compare.
That’s where healthcare benchmarking comes in.
Benchmarking allows you to compare yourself or your organization to others and it is a critical component of successful quality and performance improvement. This is especially true in clinical registries where benchmarks aren’t about rankings, but rather, achieving real-world results.
Let's dive into the basics of healthcare benchmarking in registries.
In this post we will cover:
- What Is Healthcare Benchmarking and Why Does It Matter?
- How Do You Benchmark Healthcare Performance?
- What Are Examples of Healthcare Benchmarking?
What Is Healthcare Benchmarking and Why Does It Matter?
Put simply, benchmarking in healthcare means comparing the performance of an organization or clinician to others.
The goal of benchmarking in registries is to improve quality, efficiency, and patient experience. Accurate comparisons and fair benchmarking are critical components of successful quality improvement initiatives.
When it comes to registries, benchmarks are highly valuable for individual sites or clinicians.
Your registry participants can use benchmarks to understand how they compare to others and why. Benchmarks can help orient their organization in the broader healthcare landscape. They’ll not only understand where they rank — at the bottom, middle, or top of the pack — but also understand why.
Benchmarking allows hospitals and practices, individual clinicians, and other healthcare organizations to monitor their own performance, compared to their de-identified peers, as applicable. Benchmarks can be applied to metrics about patient characteristics, volume, processes, outcomes or other meaningful categories.
How Do You Benchmark Healthcare Performance?
One way we approach benchmarking is through our reporting framework.
We look at:
- Descriptive Statistics: Who makes up my population?
- Process and Adherence: What am I doing?
- Outcomes: What are my outcomes?
- Comparison: How do I compare?
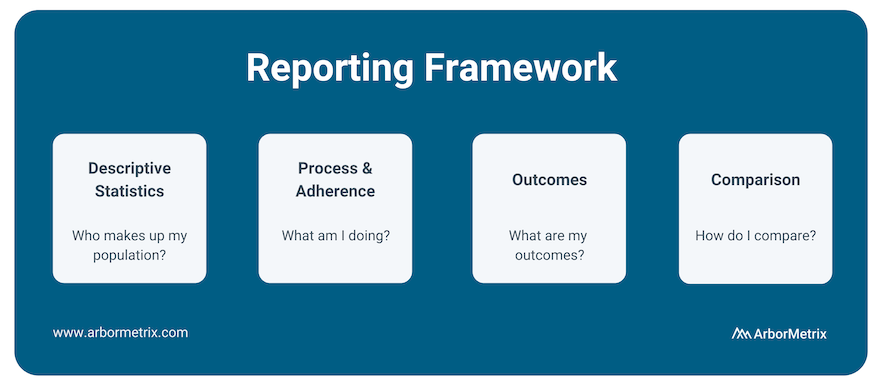
After understanding the basics of your data, what initiatives you’re undertaking regarding process and adherence, and what your outcomes look like, benchmarking your metrics against your peers is the next crucial step.
Comparison has always been a key component of our analytics and reporting framework because it uncovers opportunities to improve.
We provide reporting and peer benchmarking capabilities at the clinician, practice, multi-practice, multi-facility, and organization levels. This enables organizations to compare individual clinicians or practices/sites to the appropriate benchmark.
To accurately analyze benchmarks, you need to clearly articulate both what metrics you are comparing and what organizations you are using as comparisons.
Metrics of interest for healthcare benchmarking include:
- Mortality rates
- Length of stay
- Readmissions
- Postoperative complications
- Patient wait times
- Adherence to established protocols, such as hand washing
- Patient satisfaction
- Pharmaceutical side effects and outcomes
- Outcomes following the use of medical devices
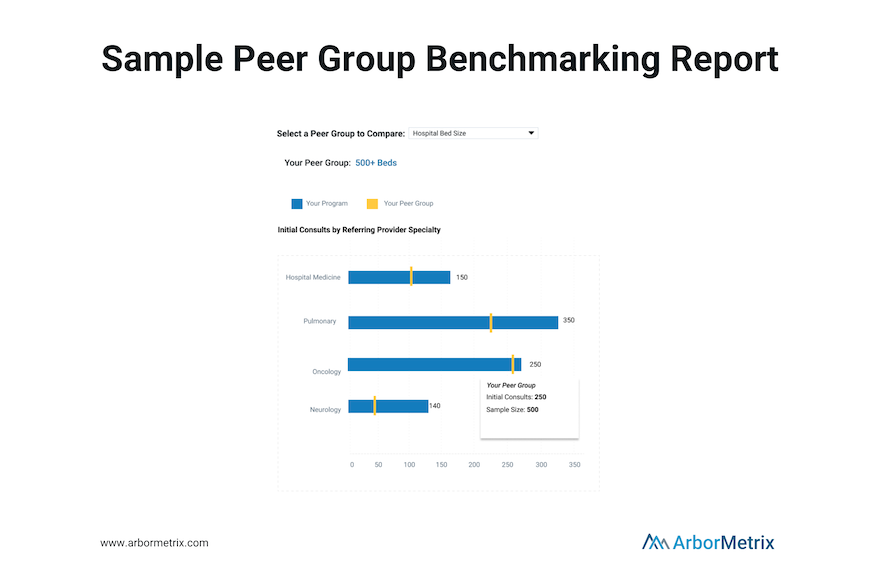
Comparison metrics are most accurate with a proper comparison group, also called a peer group. A peer group is a group of individuals or entities that share similar characteristics and interests among one another. Importantly, peer groups allow organizations to compare themselves to other, similar organizations.
To accurately identify your peer group, consider the following characteristics of healthcare organizations and practices:
- Bed size
- Procedure volume
- Provider volume
- Practice type (Private Practice, Academic/Research Hospital, Healthcare System, Outpatient Lab, Federal Government Facility)
- Private practices
- Geographic type (e.g. urban, rural suburban)
- Teaching hospital
- Department
- Single-specialty vs. multi-specialty
- Region
Benchmarking is a key competency of all reporting in our registries. We make the process simple by configuring specific groups for aggregation and benchmarking for you. The benchmark groups available to you can be managed through your administrative dashboard and you can modify them at any time. We include an organization-wide ‘All’ benchmark, as well as the ability to create peer groups of custom benchmarks. You can visually compare your organization’s performance to any benchmark, and benchmark values are color-coded on reports to allow for ease of use.