
The Basics of Clinical Quality Measures (CQMs) for Registries

In this series on quality measurement, we will discover and discuss measure development from definition to implementation and discover why quality measures are so impactful for clinical data registries.
Quality means that care delivered has value: It is safe, effective, focused on the patient, timely, and equitable. That’s why quality measures are so important.
Quality measurement is a major component of measurement science and healthcare quality – especially in clinical registries. These methodologies are responsible for the creation and implementation of performance metrics, development of testing methods, and other quality-promoting activities. [1]
In this post we will cover:
- What Is a Clinical Quality Measure (CQM)?
- Why Quality Measurement?
- Types of Quality Measures
- The Evolution of Quality Measures
- What Role Do Registries Play in Quality Measurement?
What Is a Clinical Quality Measure (CQM)?
Quality measures are defined as metrics that quantify healthcare processes, outcomes, patient perceptions, and organizational systems related to high-quality healthcare.
The structure for measurement was created in what is known as the Donabedian model, a conceptual model that provides the framework for evaluating quality in the healthcare setting. [2]
To achieve the ends of quality improvement, quality measures must help evaluate whether a metric meets certain healthcare quality criteria defined in the Institute of Medicine’s six domains [3]:
- Effectiveness: Relates to providing care processes and achieving outcomes as supported by scientific evidence.
- Efficiency: Relates to maximizing the quality of a comparable unit of health care delivered or unit of health benefit achieved for a given unit of health care resources used.
- Equity: Relates to providing health care of equal quality to those who may differ in personal characteristics other than their clinical condition or preferences for care.
- Patient centeredness: Relates to meeting patients’ needs and preferences and providing education and support.
- Safety: Relates to actual or potential bodily harm.
- Timeliness: Relates to obtaining needed care while minimizing delays.
Why Quality Measurement?
Without quality measurement, it is difficult to ascertain whether processes and interventions intended to improve health are effective, safe, efficient, equitable, or timely.
Quality measures provide an objective way to quantify adequacy and appropriateness of care while identifying strengths and weaknesses of a healthcare system.
We also use measures not only to improve the quality of care and reduce cost, but also to minimize disparities in care.
Types of Quality Measures
The Centers for Medicare and Medicaid Services (CMS) has outlined a blueprint for quality measurement. This is intended to walk measure developers through the process of creating and maintaining quality measures.
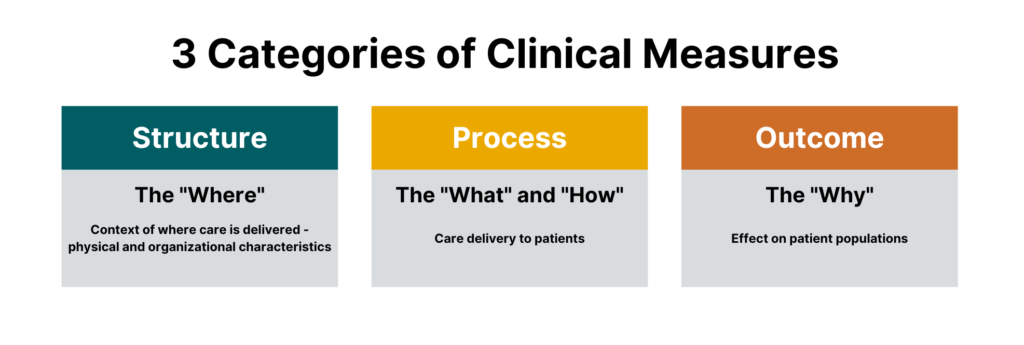
While there are many different sub-types of measures, measures generally fall under three categories:
- Process measures
- Structural measures
- Outcome measures
 One could argue that there is a fourth major category that falls outside of the Donabedian model, which are balance measures — metrics that ensure improvements to one part of the system are not having an adverse impact in other areas.
All are crucial for quality healthcare delivery, and all are part of today’s most impactful clinical registries.
Process Measures
Process measures are the most common type of quality measures. They evaluate transactions between patients and providers. Process measures represent specific steps taken to achieve a positive improvement or the reduction of a harmful outcome.
Examples of process measures include measuring the percentage of women who have had mammograms or the percentage of patients who had their hemoglobin A1C checked for diabetes control.
Structural Measures
Structural measures assess the context in which healthcare is delivered and evaluate the quality of the healthcare setting. An example of a structural measure is whether a practice uses Certified EHR Technology or whether they use e-prescribing to send patient prescriptions to pharmacies.
Outcome Measures
While they are the hardest to evaluate, outcome measures are arguably the most valid since they assess the effectiveness of healthcare on patient populations.
Determining the root causes of an outcome in a healthcare setting can be challenging because many factors other than medical intervention can influence a particular outcome. [2] Hence, outcome measures should be seen as a way of indirectly assessing the quality of care and should be evaluated in the context of the processes and structure that produce the outcome.
An example of an outcome measure is the Hospital-Wide, 30-Day, All-Cause Unplanned Readmission (HWR) Rate for the Merit-Based Incentive Payment Program (MIPS) Groups. This population health outcome measure serves as the attribution metric for clinicians in MIPS and assesses the readmission rate of patients within five specialty cohorts.
The Evolution of Quality Measures
While all quality measures generally have the same makeup, the data sources and administration of quality measures can differ.
Historically, all quality measures were collected in a manual form, but some modern measures can be calculated solely through the use of electronic data from the electronic health record (EHR). These are known as electronic clinical quality measures (eCQMs).
Clinical Quality Measures (CQMs)
Clinical quality measures use a variety of data sources including the electronic health record, but most often include manual chart abstraction. This requires measure flows to aid an abstractor in finding data for the measure in different areas. Clinical quality measures can use a wide variety of data and sources but require the most human intervention in collection and reporting.
Electronic Clinical Quality Measures (eCQMs)
Electronic clinical quality measures (eCQMs) are tools that help measure and track quality-of- care services that clinicians and hospitals provide using structured data produced by a provider’s EHR. Using eCQMs helps to reduce error, cost, clinician burden, and helps to promote efficient and effective care.
However, eCQMs are constrained to data stored in the EHR, which limits utility. While the number of eCQMs currently available are limited, the move to include more structured data in electronic health records and the mandate from CMS to move to digital measures will cause growth in this area. [4]
What Role Do Registries Play in Quality Measurement?
Quality measures are collected through many means, including administrative claims, assessments, chart abstraction, and registries.
As a repository for clinical data and an engine to calculate outcomes, registries are integral in the function of many quality and accountability programs including the CMS QPP and the NCQA HEDIS program.
Quality measures are the first tool in your quality improvement arsenal and the registry can provide insights on whether healthcare processes, products, treatments, therapies, and practitioners are performing well.
Quality measures are the cornerstones of many quality programs including regulatory reporting, performance improvement, and registry program management. These metrics provide objective approaches to data collection, healthcare benchmarking, and outcomes reporting.
In our next blog in this two-part series, we will dive into the creation of quality measures, pitfalls to avoid, and resources to help you be successful.

What Are Risk and Reliability Adjustment and Why Do They Matter?

Measuring clinical performance is challenging. Some patients are older or sicker; some have more advanced clinical conditions. Measurement populations are rarely large enough to eliminate chance. To accurately measure clinical performance, you need to control for these confounders and mitigate the role of chance. You need accurate measurement of outcomes, processes, and costs to meaningfully improve the quality and efficiency of care delivery. You also need to be able to compare the performance of different providers to one another and track changes over time.
To that effect, there are three key technologies that are essential to success in measuring and improving performance in healthcare: risk adjustment, reliability adjustment, and on-demand performance feedback.
In this post we will cover:
- Risk and Reliability Adjustment in Healthcare: The Basics
- Risk Adjustment Methods
- Reliability Adjustment Methods
- On-Demand Performance Feedback
Risk and Reliability Adjustment: The Basics
Let’s start out with a simple equation:
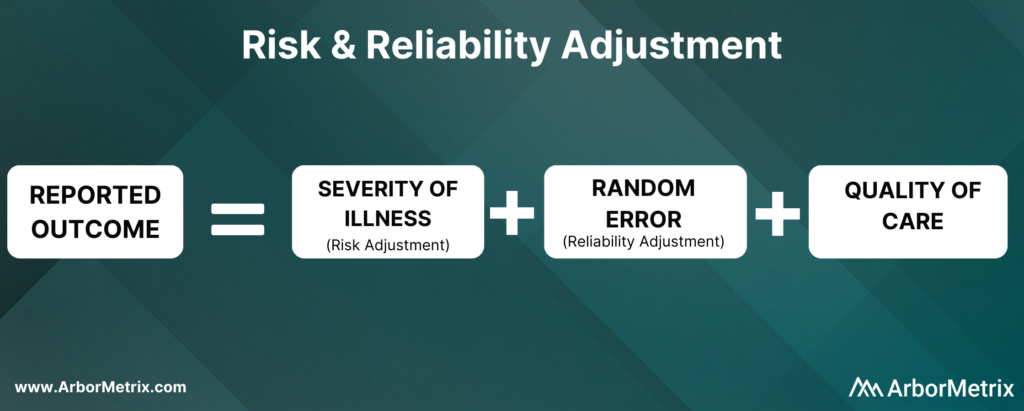
Now, let’s break this equation down and define each component.
What Is Risk Adjustment?
Risk adjustment is a process that corrects for the severity of a patient’s illness. In other words, adjusting for risk levels the playing field and ensures that comparisons of hospitals and clinicians are fair and accurate.
Why Is Risk Adjustment Important?
Some hospitals and clinicians treat more high-risk patients than others. Because of that, comparing a metric like mortality rates between two different hospitals isn’t always helpful, because one hospital is working with much more severely ill patients than the other.
In short, it’s challenging to compare outcomes like complications, utilization, and mortality rates for patients with the same condition but different health statuses.
That’s where risk adjustment comes in. Risk adjustment uses statistical models to account for clinical risk factors that differ between patients. For example, an 85-year-old female undergoing cardiac surgery is more likely to suffer adverse outcomes compared to an otherwise healthy 50-year-old male undergoing the same procedure. Comparing the two patients as if they had the same level of risk would be misleading.
We have developed our own risk adjustment methodology, which we’ll discuss in more detail in the next section. In short, we run data through scientifically and clinically validated statistical models that explicitly evaluate all patient factors that may be related to each adverse outcome. Our modeling approach adheres to all of the best practices in risk adjustment, but with significantly improved efficiency.
Reliability adjustment is a statistical technique based on hierarchical modeling that was pioneered by the ArborMetrix founders [1] and is designed to isolate the signal and reduce the noise in large datasets.
When sample sizes for a hospital or clinician are small, it can be difficult to determine if outcomes such as mortality are due to chance or to true differences in quality. Traditional analytical methods often report outcome numbers that are misleading, because clinicians and hospitals can’t determine whether they are truly different from the average.
Additionally, statistical measures like confidence intervals and p-values are often misunderstood, ignored, or relegated to a footnote. This lack of accuracy can lead to care teams addressing problem areas that are, in reality, not problematic — leading to loss of time, effort, and expense.
To optimize the effort of quality improvement work, we provide reliability adjustment in addition to risk adjustment.
Together, these methodologies ensure patient outcomes and other performance metrics are reported accurately and with enough actionable clinical detail to effectively inform improvement efforts. Importantly, these methodologies are essential to building trust in the data.
Next, we’ll take a closer look at the methods used in both types of techniques, starting with risk adjustment.
Risk Adjustment Methods
ArborMetrix has developed a unique, best-in-practice risk adjustment methodology to significantly enhance analytic efficiency. In our methodology, registry data is run through scientifically and clinically validated statistical models that evaluate all patient factors that may be related to each outcome.
Additionally, we have introduced several innovations into our technology, such as real-time model recalibration, that automate the risk-adjustment process and ensure models are well-fit to changing data.
Let’s dive a bit deeper and explore the steps involved in developing a risk model.
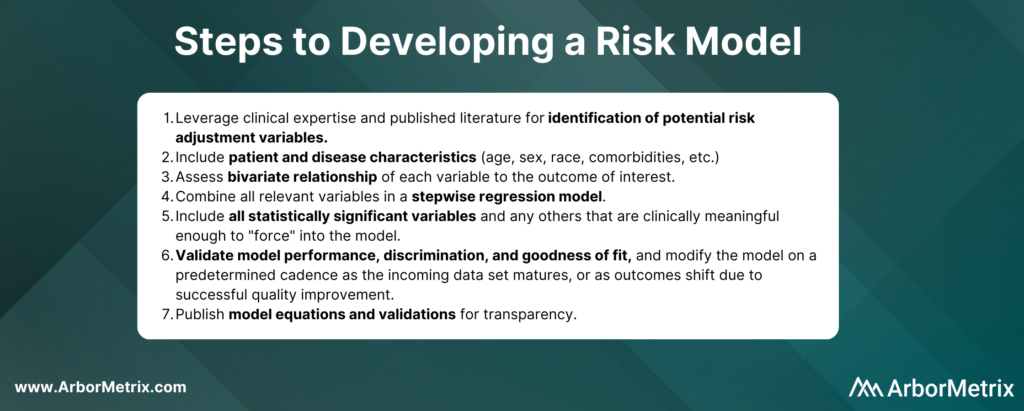
In practice, the specific risk factors included in the model will vary by outcome and by the patient populations included in the denominator for the measure. For example, some of the most important comorbidities in a risk model for serious complications of colectomy surgery include factors such as anemia, renal failure, and weight loss.
Risk adjustment corrects for the individual severity of patient illness within a dataset. With our highly efficient methodology, you can be sure that comparisons between clinicians, hospitals, or regions are accurate.
Reliability Adjustment Methods
Pioneered by our founders, reliability adjustment is a statistical technique based on hierarchical modeling that is designed to isolate the signal and reduce the noise in your dataset.
More specifically, when sample sizes for a hospital or clinician are small, the observed rates or rare outcomes may be due to chance and should be considered less precise than rates based on larger sample sizes.
What Is Reliability Adjustment?
Reliability is a measure of this imprecision, where a value of “0” means the outcome is 100% noise (completely unreliable) and a value of “1” means the outcome is 100% signal (perfectly reliable). In practice, most outcomes have reliability between 0 and 1.
Why Is Reliability Adjustment Important?
Reliability adjustment is important in certain circumstances because small sample sizes or rare outcomes create uncertainty for a hospital or clinician around whether differences in outcomes such as mortality were due to chance or true differences in quality.
For example, a hospital with a mortality rate of 50% because 1 patient died in a total of 2 cases should be interpreted very differently than if 100 out of 200 patients died. For most surgical procedures, they would need to have its mortality rate reliability-adjusted to account for the prediction that if they had 200 cases instead of 2, it would be very unlikely that their mortality rate would still be 50%.
We work with our registry partners through a methodical planning process to develop and refine clinically relevant and scientifically accurate reliability models.
Without reliability adjustment, traditional analytical methods often report outcome numbers that are misleading to clinicians and hospitals, who cannot sort out whether their performance rates are truly different from the average. Reliability adjustment helps clinicians and hospitals identify real problem areas and focus improvement activities where the greatest improvement opportunity exists.
In short, reliability adjustment corrects for random error, allowing you to trust that the analytic insights you’re generating are as accurate as possible.
MSQC Relies on Risk and Reliability Adjustment to Improve Performance
The Michigan Surgical Quality Collaborative (MSQC) is a national leader in surgical quality improvement. They help surgeons improve at the individual level by providing surgeon-specific reports to aid in performance self-assessment.
Risk adjustment is crucial to the hospital-to-hospital comparisons done routinely by MSQC, and the risk adjustment modeling and reporting development represent a combined effort between the MSQC analytic team and ArborMetrix. After the process of risk adjustment, the outcomes data is also reliability adjusted.
MSQC’s real-time, risk- and reliability-adjusted reports offer a look at each surgeon’s individual outcomes data, with a detailed drill-down on patient-level data included in the analysis. Surgeons can view their performance relative to their hospital or to the collaborative as a whole. Surgeons can also view their performance in comparison to other contributing surgeons, both within their institution and beyond, in a de-identified manner, providing even more valuable information to help surgeons identify areas for quality improvement.
MSQC is a top example of a clinical registry program that is achieving real-world quality improvement. Its members have collectively achieved outstanding results and greatly enhanced care for their patients. A few highlights include:
• 34% reduction in surgical site infection rates for colectomy procedures.
• 50% reduction in patient opioid consumption across 9 surgical procedures, with no changes to patient-reported satisfaction.
• 40% reduction in morbidity and mortality of non-trauma operations.
• Regularly published research in leading academic journals.
On-Demand Performance Feedback Makes Rapid Healthcare Improvements Possible
Having access to accurate, trusted analytical insights is helpful. Being able to act on those insights as quickly as possible is even better. That’s where on-demand performance feedback comes in.
ArborMetrix’s products deploy rigorous analytics, grounded in scientific best practices, allowing users to quickly and easily measure performance and understand their clinical outcomes and business. Our unique technology allows for reporting and the application of data science in real-time. This gives physicians access to up-to-date risk- and reliability-adjusted reporting, which builds trust and enables rapid-cycle improvements.
Traditional processes for producing reports with risk- and reliability-adjusted measures can take months using manual methods performed by statisticians. As a result, reports on comparative outcomes have traditionally been delivered in static formats that reflect old, stale data that may no longer be useful for quality improvement efforts.
With the interactive ArborMetrix platform, end-users can select different levels of aggregation, patient populations, and time periods to see dynamic risk- and reliability-adjusted reports that reflect the most up-to-date data. The combination of fresh data and flexible exploration of outcomes information means you can get useful feedback quickly.
Work With Data You and Others Can Trust
Together, risk adjustment, reliability adjustment, and on-demand performance feedback build trust in the data, which trickles down to trust in the evidence, trust in the insights, and trust in the conclusions drawn from the data. Further, having access to all of this information in real-time ensures that quality improvement efforts won’t go to waste.

Designing Healthcare Analytics to Engage Clinicians

Healthcare analytics software enables the acquisition, validation, transformation, and visualization of robust data sets. Organizations use healthcare analytics for a wide variety of purposes, including:
- The business of healthcare that analyzes financial trends and access to services.
- The delivery of healthcare aimed at driving improvements to the quality of care and care providers.
- The monitoring of healthcare treatments like devices and pharmaceutical interventions.
While the use cases are incredibly diverse, they all share a few common requirements:
- A dedication to the strict adherence to standards that keep your data safe and secure.
- A streamlined process for collecting and blending disparate data sources into a unified whole.
- A focus on improving access and outcomes for the most important stakeholder – the patient.
In order to achieve these aims, healthcare data must be engaging and interactive to support key decisions. This is especially true for clinician users.
User engagement is a key indicator to help organizations understand how decision makers like clinicians are using healthcare data and applications. User engagement metrics tell us:
- The degree to which data-driven decision making is prevalent in an organization’s culture.
- The degree to which the healthcare analytics application facilitates simple and intuitive data exploration.
At ArborMetrix, we see it as our responsibility to facilitate delightful and engaging user experiences and ultimately to inspire and support a culture of data-driven decision making in healthcare.
User-Centered Design in Healthcare Analytics
When designing healthcare analytics software to drive clinician and end-user engagement, it is crucial to understand the value proposition for key user personas. These personas represent the types of users and stakeholders who will be interacting with the product.
We leverage user-centered design principles to define personas and engage in best-practice research methods like focus groups, user observation sessions, and surveys.
Every persona has high-value needs, and we focus on designing easy and intuitive user experiences to facilitate those needs. Some examples of personas for clinical registries include quality officers, administrators, clinicians, researchers, patients and caregivers.
We tailor our user interface and workflows to align with the needs of our users. We want to ensure that they have easy access to the information and tools that matter the most to them.
Designing Healthcare Analytics Tools for Clinician Engagement
Here are a few examples of high-value opportunities for engaging clinical personas:
- Easing the burden of regulatory reporting requirements.
- Enabling meaningful benchmarks based on timely data.
- Providing quick access to relevant measures with robust filtering for custom patient cohort comparisons.
For users tasked with providing data, we aim to make data acquisition seamless by utilizing electronic connections whenever possible. When manual data entry is necessary, product capabilities for intuitive smart forms with validation logic that are attune with user workflows are critical. This is to ensure high-quality data capture with minimal effort.
It is important to capitalize on the momentum from an initial rollout of new software and plan a product roadmap to maintain engagement with new high-value capabilities and insights. Planning for growth can include expanding the scope of measures available, growing the library of reports, adding support for new personas, and releasing new product features that align with high-priority user needs.
Healthcare analytics software, purpose-designed for your users, can help you go beyond understanding how you’re performing to exploring why. That’s what inspires data-driven action and measurable improvement.

What Is Predictive Analytics and Why Is It Important?

Exploring data helps us understand our world. Why something happened, how things are trending, and what constitutes a meaningful change.
Now, we have a vast set of tools in our data analysis toolbox. We can not only examine what happened in the past, but we can also predict what might happen in the future using predictive analytics.
Predictive analytics is a powerful tool that can help us accelerate the path to healthcare value, ultimately reducing healthcare costs while improving patient care.
Read on for an introduction to predictive analytics in healthcare, including the uses, benefits, value, and potential future of predictive analytics.
In this post we will cover:
- What Is Predictive Analytics in Healthcare?
- What Is the Role of Predictive Analytics?
- What Are Use Cases of Predictive Analytics in Healthcare?
- What Is the Value of Predictive Analytics?
- What Is the Future of Predictive Analytics?
What Is Predictive Analytics in Healthcare?
Predictive analytics answers the question: what is likely to happen next?
Using modeling and forecasting techniques, predictive analytics helps determine what has a high probability of occurring in the future. Physicians, researchers, medical specialty societies, pharmaceutical companies, and every other healthcare stakeholder can then use those predictions to provide the best possible care for individual patients.
To provide the most robust predictions possible, predictive analytics uses a variety of modeling techniques, from traditional hierarchical linear models to advanced artificial intelligence (AI) and machine learning algorithms. AI is a collection of technologies that can think and adapt on their own, while machine learning, which is a subset of AI, involves generating models to describe data with greater and greater precision as more data is introduced. [1,2]
In healthcare, predictive analytics leverages AI and machine learning to analyze historical data and forecast outputs such as disease risk for individual patients. [3]
What Is the Role of Predictive Analytics?
Predictive analytics is quickly becoming a cornerstone of personalized healthcare.
Using AI and machine learning, predictive models can intake huge amounts of diverse data for a single patient and forecast a patient’s response to certain treatments or devices, their risk of developing a specific disease, and their prognosis for a given condition.
What is personalized healthcare? This customized way of treating a patient is rooted in that individual’s specific medical history, environment, social risk factors, genetics, and unique biochemistry, among other characteristics. The key to personalized healthcare is treating a patient based on their specific attributes, instead of relying on population averages that aren’t one-size-fits-all. [4]
Predictive analytics is helping the healthcare system shift from treating a patient as an average to treating a patient as an individual, which can only improve patient care overall in terms of quality, efficiency, cost, and patient satisfaction.
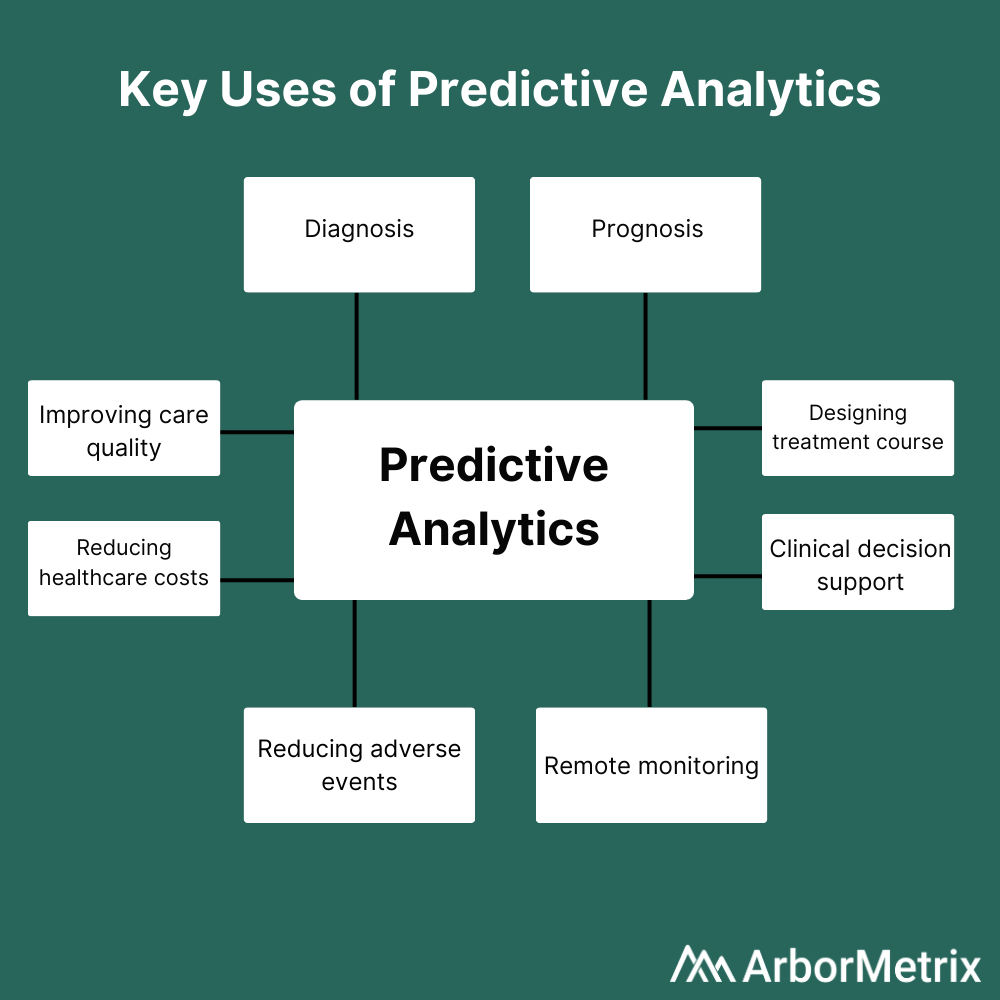
Use Cases of Predictive Analytics in Healthcare
Predictive analytics is useful at every step in a patient’s journey, including diagnosis, prognosis, and treatment. Predictive analytics can also inform remote patient monitoring and reduce adverse events. On a more macro level, predictive analytics can improve care quality while reducing costs.
 Leveraging predictive analytics can help answer questions like:
- What is the best course of treatment for this patient?
- Is this patient likely to experience an adverse event following a given procedure?
- What is the likelihood that this patient has a malignant tumor?
Here are a few key examples of predictive analytics in healthcare being used at various points in the patient journey:
- Diagnosis: Predictive analytics have been used to predict malignant mesothelioma diagnoses in a patient cohort. Patients diagnosed early can start treatment immediately, which improves their chances of survival—thus making prediction a critical tool. [5]
- Prognosis: Researchers used predictive analytics on physiological data from patients with congestive heart failure (CHF) to predict which patients were at greatest risk of readmission following a hospital stay. Using that information, physicians could implement interventions early to prevent the predicted readmissions. [6]
- Treatment: Clinicians have used machine learning-based predictive analytic models to determine the most effective course of treatment for chronic pain patients. [7]
Most importantly, predictive analytics can provide real-time clinical decision support at the point of care, making personalized healthcare as efficient as possible.
This is just a small sliver of the research being performed using predictive analytics in healthcare. As technology and analytic models advance, more opportunities to improve patient care using forecasting techniques will surely be discovered.
What Is the Value of Predictive Analytics?
Wherever there is data, predictive analytics can produce tremendous value. Leading organizations leverage predictive analytics to generate real-world results. Let’s look at an example below.
Michigan Bariatric Surgery Collaborative (MBSC) Uses a Predictive Calculator to Forecast Bariatric Surgery Outcomes
MBSC, a quality improvement collaborative funded by Blue Cross Blue Shield, leverages a powerful patient registry to improve bariatric surgery in Michigan.
MBSC uses clinical and patient-reported data combined with powerful predictive analytics to support clinical decision-making. Participating physicians use the MBSC registry and patient engagement tools to collect comprehensive preoperative data for potential bariatric surgery patients.
This data is then used to feed the MBSC Predictive Outcomes Calculator, a publicly available tool physicians can use to predict a patient’s weight loss, comorbidity resolution, and complication rate after bariatric surgery.
Specifically, the tool uses patient information on demographics, comorbidities, and other risk factors to forecast:
- Predicts weight loss at years 1, 2, and 3 for each of the available procedures.
- Predicts the likelihood of resolving weight-related comorbidities such as diabetes or sleep apnea.
- Predicts the likelihood of adverse events, serious complications and mortality.
Notably, the predicted rates for weight loss, comorbidity resolution, and potential complications are patient-specific, using risk-adjusted, real-world outcomes data from similar patients. These tools and other quality improvement initiatives helped MBSC and its members decrease rates of venous thromboembolism (VTE) by 43% and decrease post-surgical death rates by 67%.
What Is the Future of Predictive Analytics?
As we amass more and more data, predictive analytics will become both more common and more accurate.
Currently, many predictive models use traditional statistical methods, such as logistic regression, which are useful and can provide insightful results. However, AI and machine learning methods such as random forests, when implemented appropriately, can provide more accurate predictions. Ultimately, as more feature-rich data is collected and as the collection process itself improves, predictive analytics can take advantage of deep learning algorithms that can make better use of large and complex data sets. [8]
For example, deep learning algorithms can be used for image recognition, whether that be images gleaned from MRIs or other types of imaging technology, to automatically detect certain features. In contrast, a machine learning-based approach would require the radiologist to extract all the features from the image first. Deep learning simplifies the process by detecting all the features automatically, without requiring extra work by the radiologist.
Put simply, big data and predictive analytics in healthcare go hand in hand—more data means better predictions.
Additionally, the field of predictive analytics will advance to overcome its limitations. One current drawback is that predictive analytics is not able to provide insight into what might happen after an intervention or other change, which can be frustrating for researchers and clinicians who want to understand how patients might fare after a new treatment or as a result of a new hospital procedure. We expect predictive analytics will advance past this challenge, allowing researchers to forecast the future in a much more expansive and holistic way.
Predictive analytics will also be able to benefit from the massive leaps in computer processing power that make chewing through complicated algorithms possible.
Someday soon, predicting the future with accuracy under a variety of conditions will be the norm, not a fortune-teller’s trick.
Whichever Direction Your Predictive Analytics Journey Takes You, You’ll Need a Guide

What Is Healthcare Analytics and Why Is It Important?

Let’s face it: data is everywhere, especially in healthcare. From electronic health records to patient-reported outcomes, data piles up and can feel overwhelming without the tools and resources to make sense of it.
Applying big data analytics is the solution. Read on for an introduction to healthcare data analytics, including the types, uses, value, and potential future of data analytics in healthcare.
In this post we will cover:
- What Is Data Analytics in Healthcare?
- What Is the Role of Data Analytics in Healthcare?
- What Are the Types of Healthcare Analytics?
- How Is Healthcare Analytics Used?
- What Is the Value of Healthcare Analytics?
- What Is the Future of Data Analytics in Healthcare?
What Is Data Analytics in Healthcare?
In general, big data analytics is the practice of using analytical techniques to make sense of large sets of diverse data. [1] In healthcare, unwieldy data sets are the norm. A comprehensive data entry for a single patient could include everything from electronic health record data and physician notes to imaging, prescriptions, lab results, insurance, monitoring equipment output, and even social media posts.
Data sets like these are often impossible to analyze on more general, commonly used software platforms and hardware systems. [1] This is where the application of big data analytics in healthcare becomes a must-have instead of just a nice-to-have.
Advancing healthcare and improving patients’ lives requires both measurement and extensive analysis of these large sets of healthcare data to glean valuable, actionable insights. [1] Physicians, researchers, medical specialty societies, pharmaceutical companies, and every other healthcare stakeholder can then use these insights as jumping-off points for improvement.
What Is the Role of Data Analytics in Healthcare?
The role of data analytics in healthcare is clear: Pull the signal from the noise.
Whether you need to improve quality, advance research, manage risk, or anything in between, you have access to mountains of data. However, just having the data won’t do you much good if you don’t have a systematized way to organize, analyze, and interpret it.
This is one of the reasons why data analytics is so important in healthcare. By using analytical techniques, you can not only make sense of the past, but also chart a course for the future, for the benefit of the entire healthcare community.
What Are the Types of Healthcare Analytics?
One of the benefits of data analytics in healthcare is that there are many types you can use to answer many questions.
Let’s say you’re interested in readmission rates after surgical procedures. You’ll want to answer questions like: How did hospital readmission rates change over the past five years? What surgical procedures were associated with the highest readmission rates? What will readmission rates look like over the next year without any interventions? How could a potential intervention affect readmissions?
Healthcare analytics can help answer all of these questions. Let’s dive deeper into the four main types of healthcare analytics, their definitions, what questions they answer, and the potential limitations of each.
- Descriptive analytics uses data from the past to provide insights around trends or benchmarks, usually in the form of a dashboard. While descriptive analytics helps us understand what happened in the past, it is unable to provide strong insights to influence future health outcomes or provide foresight into potential future events.
- Predictive analytics uses modeling and forecasting to determine what is likely to happen next. Predicting the future is useful, but results are predicated on all conditions remaining the same. Predictive analytics is unable to provide insight into what might happen after an intervention or other change.
- Prescriptive analytics uses machine learning to suggest a course of action or strategy by taking in numerous inputs. Prescriptive analytics helps us understand what the effects of a specific action will be, but the inherent uncertainty and limited maturity of this type of analytics could lead to implementing suboptimal actions.
- Discovery analytics uses machine learning to analyze raw data to determine interconnections, patterns, and outliers. Discovery analytics helps us understand what we need to explore further, but raw data can be incomplete or inaccurate, limiting its usefulness.
How Is Healthcare Analytics Used?
Data analytics can help improve healthcare for all industry stakeholders, from health systems and physicians to patients, pharmaceutical and medical device companies, and specialty societies.
The many uses of big data analytics in healthcare can be organized into four main buckets. Healthcare analytics can help your organization enhance its competitive position, improve quality, advance research initiatives, and manage risk and reporting.
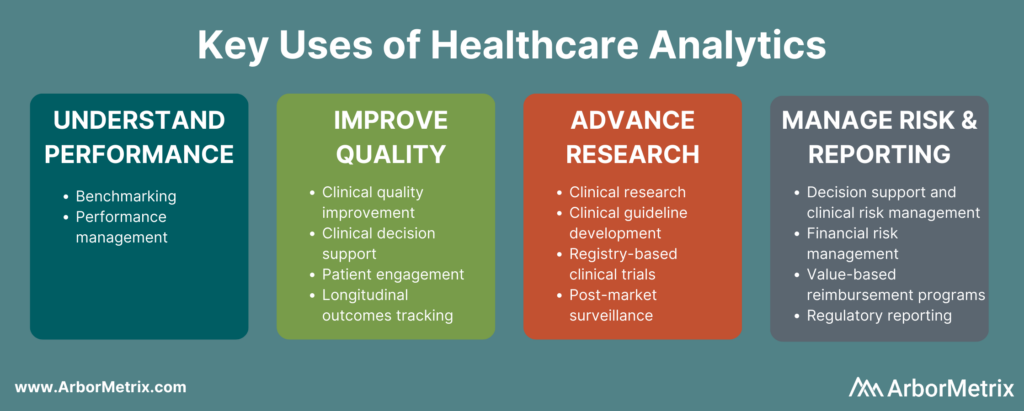
To tap into these key uses of healthcare analytics, you need cutting-edge software and a trusted process to take you from an unmanageable jumble of data to actionable, real-world evidence.
That process involves:
- Acquiring the data: Whether you use machine-to-machine data transfer, patient surveys, employed nurses abstracting data from case files, or all of the above, all data needs to be collected in one place.
- Transforming the data: Here, the data is cleaned, validated, and analyzed to answer research questions.
- Acting on the analytical insights: Leverage real-world evidence to reach your organization’s goals.
In addition, you’ll want to make sure your data analytics software solution is flexible enough to evolve with your needs, and that it’s built with high-level security features in place. That way, you’ll have everything you need to unlock the greatest possible value from your data.
What Is the Value of Healthcare Analytics?
Beyond its many uses, healthcare analytics provides real-world value to those who act on analytical insights. Below, you’ll find an example of a health industry player that has reaped the benefits of using big data analytics in healthcare.
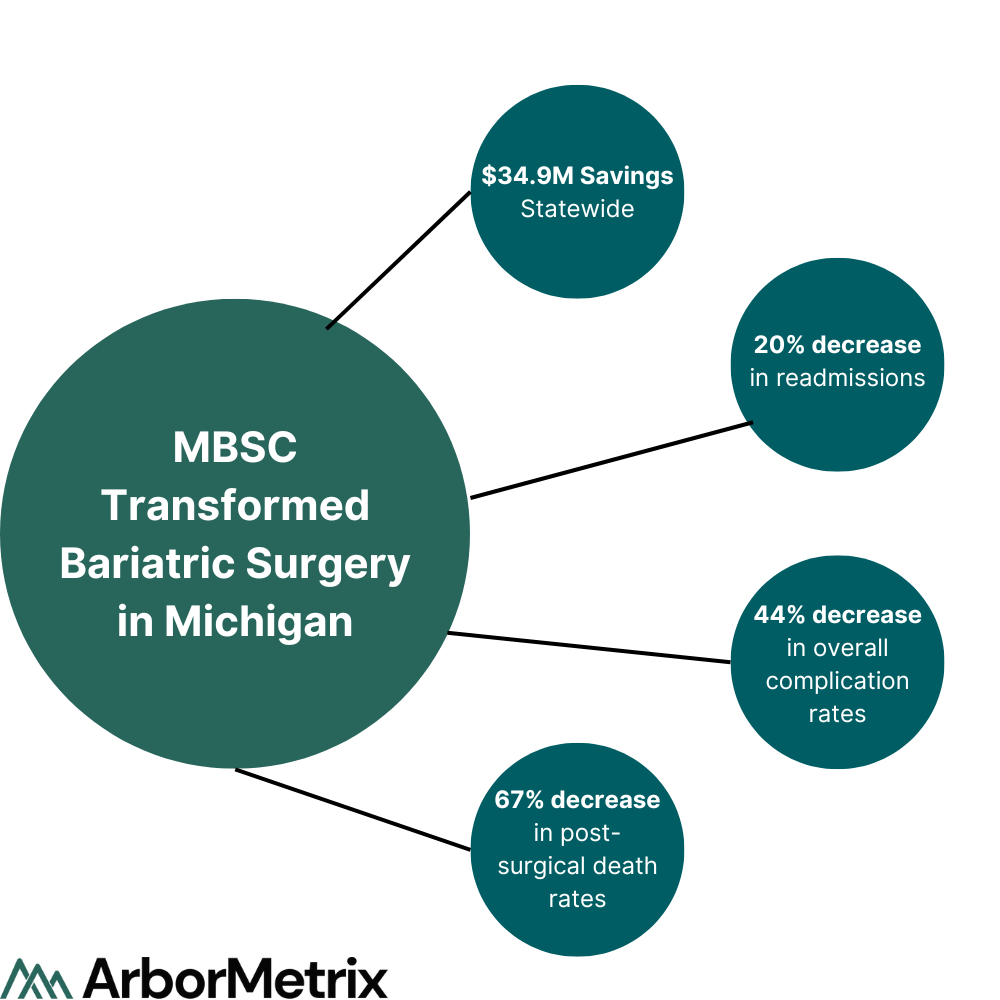
The Michigan Bariatric Surgery Collaborative (MBSC) Reduced Post-Surgical Death Rates by 67%
MBSC, a quality improvement collaborative funded by Blue Cross Blue Shield, leverages a powerful patient registry to improve bariatric surgery in Michigan. MBSC used the ArborMetrix platform to power outcomes calculators, patient-reported outcomes, and video surgical analysis, resulting in a 67% decrease in post-surgical death rates and $35 million in statewide savings, among other impressive results.
What Is the Future of Data Analytics in Healthcare?
New technologies are continuing to emerge that push the boundaries of how healthcare analytics can be used. From artificial intelligence to machine learning to natural language processing, the true future of healthcare is in wielding these technologies for greater impact.
Artificial intelligence (AI) refers to a collection of technologies that can autonomously think and adapt with intention. [3,4] In healthcare, AI can use input data to diagnose disease, structure clinical trial cohorts, and identify malignant tumors, among many other uses.
Machine learning and natural language processing are subsets of AI. Machine learning involves generating models to describe data. As more data is introduced, the algorithms adapt to the new information to create models that fit the data as accurately as possible. [3] Machine learning is often used in precision medicine in a predictive capacity—given a patient’s unique medical history, machine learning techniques can predict what treatment is most appropriate.
Natural language processing (NLP) uses various techniques to make sense of human-generated speech or writing. [3] NLP is especially useful for extracting information from patient records and classifying clinical documents.
This is just a taste of what’s in store for healthcare data analytics. With technology advancing at a rapid clip, new discoveries that can create even greater impact are inevitable.
-