
The Basics of Clinical Quality Measures (CQMs) for Registries

In this series on quality measurement, we will discover and discuss measure development from definition to implementation and discover why quality measures are so impactful for clinical data registries.
Quality means that care delivered has value: It is safe, effective, focused on the patient, timely, and equitable. That’s why quality measures are so important.
Quality measurement is a major component of measurement science and healthcare quality – especially in clinical registries. These methodologies are responsible for the creation and implementation of performance metrics, development of testing methods, and other quality-promoting activities. [1]
In this post we will cover:
- What Is a Clinical Quality Measure (CQM)?
- Why Quality Measurement?
- Types of Quality Measures
- The Evolution of Quality Measures
- What Role Do Registries Play in Quality Measurement?
What Is a Clinical Quality Measure (CQM)?
Quality measures are defined as metrics that quantify healthcare processes, outcomes, patient perceptions, and organizational systems related to high-quality healthcare.
The structure for measurement was created in what is known as the Donabedian model, a conceptual model that provides the framework for evaluating quality in the healthcare setting. [2]
To achieve the ends of quality improvement, quality measures must help evaluate whether a metric meets certain healthcare quality criteria defined in the Institute of Medicine’s six domains [3]:
- Effectiveness: Relates to providing care processes and achieving outcomes as supported by scientific evidence.
- Efficiency: Relates to maximizing the quality of a comparable unit of health care delivered or unit of health benefit achieved for a given unit of health care resources used.
- Equity: Relates to providing health care of equal quality to those who may differ in personal characteristics other than their clinical condition or preferences for care.
- Patient centeredness: Relates to meeting patients’ needs and preferences and providing education and support.
- Safety: Relates to actual or potential bodily harm.
- Timeliness: Relates to obtaining needed care while minimizing delays.
Why Quality Measurement?
Without quality measurement, it is difficult to ascertain whether processes and interventions intended to improve health are effective, safe, efficient, equitable, or timely.
Quality measures provide an objective way to quantify adequacy and appropriateness of care while identifying strengths and weaknesses of a healthcare system.
We also use measures not only to improve the quality of care and reduce cost, but also to minimize disparities in care.
Types of Quality Measures
The Centers for Medicare and Medicaid Services (CMS) has outlined a blueprint for quality measurement. This is intended to walk measure developers through the process of creating and maintaining quality measures.
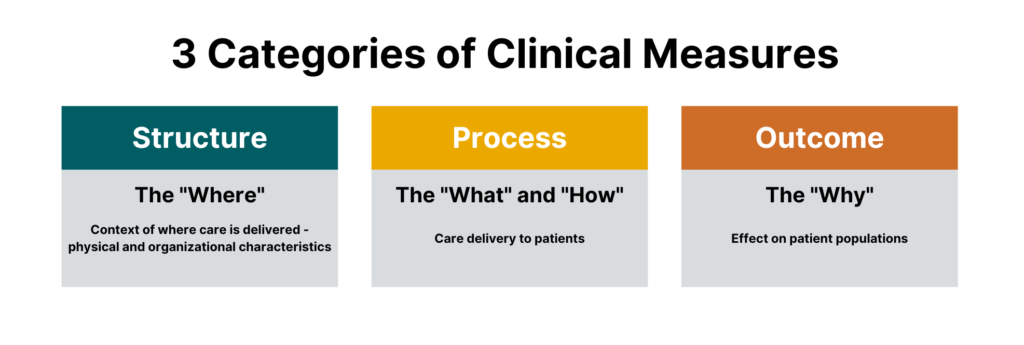
While there are many different sub-types of measures, measures generally fall under three categories:
- Process measures
- Structural measures
- Outcome measures
 One could argue that there is a fourth major category that falls outside of the Donabedian model, which are balance measures — metrics that ensure improvements to one part of the system are not having an adverse impact in other areas.
All are crucial for quality healthcare delivery, and all are part of today’s most impactful clinical registries.
Process Measures
Process measures are the most common type of quality measures. They evaluate transactions between patients and providers. Process measures represent specific steps taken to achieve a positive improvement or the reduction of a harmful outcome.
Examples of process measures include measuring the percentage of women who have had mammograms or the percentage of patients who had their hemoglobin A1C checked for diabetes control.
Structural Measures
Structural measures assess the context in which healthcare is delivered and evaluate the quality of the healthcare setting. An example of a structural measure is whether a practice uses Certified EHR Technology or whether they use e-prescribing to send patient prescriptions to pharmacies.
Outcome Measures
While they are the hardest to evaluate, outcome measures are arguably the most valid since they assess the effectiveness of healthcare on patient populations.
Determining the root causes of an outcome in a healthcare setting can be challenging because many factors other than medical intervention can influence a particular outcome. [2] Hence, outcome measures should be seen as a way of indirectly assessing the quality of care and should be evaluated in the context of the processes and structure that produce the outcome.
An example of an outcome measure is the Hospital-Wide, 30-Day, All-Cause Unplanned Readmission (HWR) Rate for the Merit-Based Incentive Payment Program (MIPS) Groups. This population health outcome measure serves as the attribution metric for clinicians in MIPS and assesses the readmission rate of patients within five specialty cohorts.
The Evolution of Quality Measures
While all quality measures generally have the same makeup, the data sources and administration of quality measures can differ.
Historically, all quality measures were collected in a manual form, but some modern measures can be calculated solely through the use of electronic data from the electronic health record (EHR). These are known as electronic clinical quality measures (eCQMs).
Clinical Quality Measures (CQMs)
Clinical quality measures use a variety of data sources including the electronic health record, but most often include manual chart abstraction. This requires measure flows to aid an abstractor in finding data for the measure in different areas. Clinical quality measures can use a wide variety of data and sources but require the most human intervention in collection and reporting.
Electronic Clinical Quality Measures (eCQMs)
Electronic clinical quality measures (eCQMs) are tools that help measure and track quality-of- care services that clinicians and hospitals provide using structured data produced by a provider’s EHR. Using eCQMs helps to reduce error, cost, clinician burden, and helps to promote efficient and effective care.
However, eCQMs are constrained to data stored in the EHR, which limits utility. While the number of eCQMs currently available are limited, the move to include more structured data in electronic health records and the mandate from CMS to move to digital measures will cause growth in this area. [4]
What Role Do Registries Play in Quality Measurement?
Quality measures are collected through many means, including administrative claims, assessments, chart abstraction, and registries.
As a repository for clinical data and an engine to calculate outcomes, registries are integral in the function of many quality and accountability programs including the CMS QPP and the NCQA HEDIS program.
Quality measures are the first tool in your quality improvement arsenal and the registry can provide insights on whether healthcare processes, products, treatments, therapies, and practitioners are performing well.
Quality measures are the cornerstones of many quality programs including regulatory reporting, performance improvement, and registry program management. These metrics provide objective approaches to data collection, healthcare benchmarking, and outcomes reporting.
In our next blog in this two-part series, we will dive into the creation of quality measures, pitfalls to avoid, and resources to help you be successful.

The Value of Registries in Post-Market Surveillance

Clinical data registries are useful across many parts of healthcare. One of their most valuable purposes is post-market surveillance.
Registries are designed to collect, analyze, and interpret large amounts of real-world data setting the foundation for successful post-market surveillance. When registries are built well, the result is a vast data resource that provides real-time, ongoing data collection, and is a central source of truth to answer key questions like:
- How is a device or drug actually used in real-world settings?
- What does the typical target patient look like?
- How does a product truly perform for the target patient population versus sub-populations that differ by age, gender, race/ ethnicity, geography and combination of comorbidities?
Let’s dig into how registries are used in post-market surveillance, starting with some key definitions.
In this post we will cover:
- What Is Post-Market Surveillance?
- What Are the Goals of Post-Market Surveillance?
- What Is the Value of Post-Market Surveillance?
- How Do You Conduct Post-Market Surveillance?
- How Do Clinical Registries Drive Post-Market Surveillance?
What Is Post-Market Surveillance?
Post-market surveillance (also called post-marketing surveillance) demonstrates the real-world safety and effectiveness of medical devices and pharmaceuticals.
The U.S. Food and Drug Administration (U.S. FDA) defines it as “the active, systematic, scientifically valid collection, analysis, and interpretation of data or other information about a marketed device.” [1]
This definition underscores that post-market surveillance is an active, ongoing process – not a one-off. It also emphasizes data science as a critical part.
The European Medical Device Regulation (E.U. MDR) defines it as “all activities carried out by manufacturers in cooperation with other economic operators to institute and keep up to date a systematic procedure to proactively collect and review experience gained from devices they place on the market, make available on the market or put into service for the purpose of identifying any need to immediately apply any necessary corrective or preventive actions.”
Similar to the U.S. FDA, the EU MDR also highlights the need for a post-market surveillance system that provides up-to-date insights. But it goes a step further to call out the importance of using those insights to make adjustments and improvements.
What Are the Goals of Post-Market Surveillance?
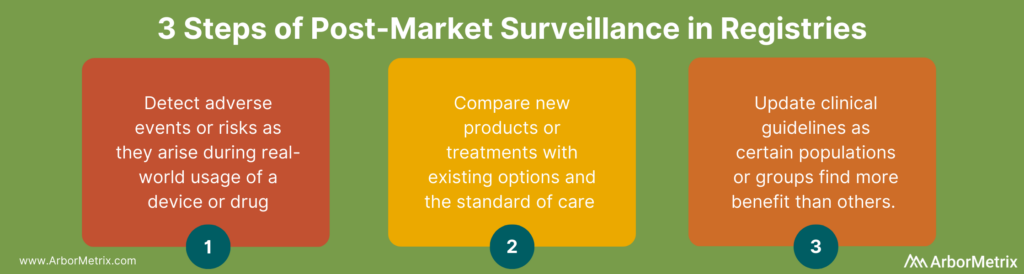
Pharma and medical device companies rely on the real-world insights they gain through post-market surveillance activities to:
- Detect adverse events or risks as they arise during real-world usage of a device or drug.
- Compare new products or treatments with existing options and the standard of care.
- Update clinical guidelines as certain populations or groups find more benefit than others.
- Comply with regulatory requirements.
There are many different aspects of a device or product that are assessed in post-market surveillance. A few examples include:
- Clinical effectiveness: Use data from real-world clinical settings to examine the relative effectiveness of a device or drug in a large, diverse patient group to compare that product to the standard of care or competition.
- Adverse events and side effects: Leverage real-world evidence to identify risks or adverse reactions that might have been missed in the initial clinical trial for a device or drug.
- Utilization: Examine how a product is actually used in the real world, which can be different than what is approved or marketed.
What Is the Value of Post-Market Surveillance?
Real-world evidence delivered through post-market surveillance offers differing importance for different stakeholders.
For medical device companies and pharmaceutical companies, post-market surveillance can provide additional information on the natural history of disease and the relative performance of their product to the disease, as well as other marketed products. The veracity of evidence acquired through an appropriately designed registry or post-market surveillance program enables the sponsoring company to then tweak clinical, marketing and pricing strategies accordingly to develop new and improved patient-centric products.
For clinicians and provider organizations, post-market surveillance can provide information on how products perform relative to others in the context of real-world patient populations, which are often materially different from clinical trial populations. This can then inform treatment decisions, including off-label use of products.
For payers and regulatory agencies, post-market surveillance can shed light on which products and drugs are the safest and most cost-effective. This can then inform coverage and reimbursement decisions.
How Do You Conduct Post-Market Surveillance?
Let’s break down the U.S. FDA’s definition of post-market surveillance into three components:
- Data Collection
- Data Analysis
- Data Interpretation
These are the steps to conducting post-market surveillance for medical devices and drugs.
Step 1: Data Collection for Post-Marketing Surveillance
You need the right data sources and the right technology to collect real-world data efficiently, securely, and accurately for post-market surveillance activities.
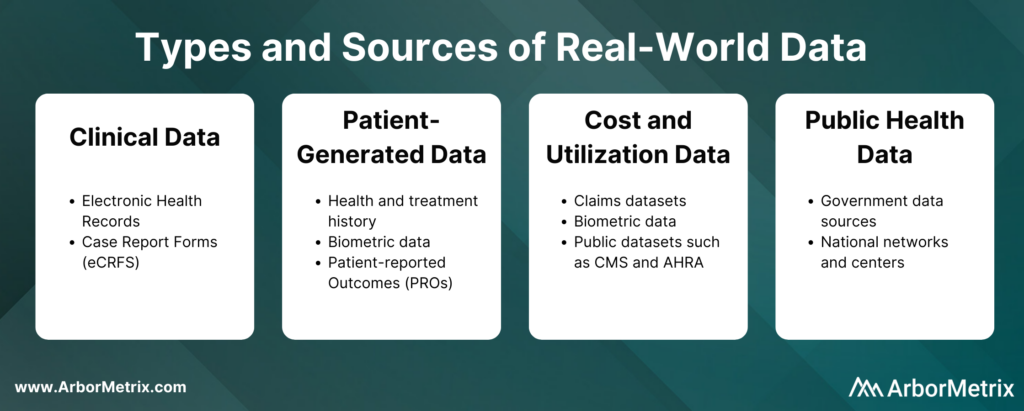
These real-world data can come from several sources, such as:
- Clinical data from electronic health records (EHRs) and case report forms (eCRFs)
- Patient-generated data from patient-reported outcome (PRO) surveys
- Cost and utilization data from claims and public datasets
- Public health data from various government data sources
These real-world data are collected in two primary ways:
- Machine-to-machine data connection allows you to securely and efficiently collect real-time data from any number of systems, including electronic health records and administrative claims.
- Human-to-machine data collection allows you to capture essential care details and specialized information with electronic case report forms. It also allows you to collect patient-reported outcomes (PROs) or gain insights directly from patients, clinicians, and others through web-based surveys.
The technology you use to get this data matters. You need an efficient and secure way to collect large amounts of real-world data and prepare it for analysis.
Step 2: Data Analysis for Post-Marketing Surveillance
Once you collect data for a given device or product, the next step is transforming it into real-world evidence. This involves combining, blending, validating, and analyzing various data sources. These analyses can be risk- and reliability-adjusted according to the data ingested, and then presented to stakeholders in an interactive and engaging way.
Step 3: Data Interpretation for Post-Marketing Surveillance
Once you are finished collecting and analyzing data, you need a way to interpret the data easily and readily. Here are a few things to keep in mind:
- To ensure timely and accurate interpretation of data, you need statistically-adjusted reports that are available in real-time. This helps you quickly and easily measure and understand clinical outcomes, determine patient quality of life, and understand the total financial impact of the intervention.
- Statistically-adjusted reports should be built using key risk and reliability adjustment methodologies that are essential to success in maximizing data value.
How Do Clinical Registries Drive and Use Post-Market Surveillance?
Clinical data registries are uniquely useful in their ability to facilitate post-market surveillance for three reasons.
- They advance post-market surveillance activities to help us better understand the real-world safety and effectiveness of procedures, treatments, and devices.
- They solve complex problems for device and pharma companies. These organizations in general are faced with complex barriers when seeking real-world data for purposes of research and development, quality improvement, or regulatory requirements.
- They deliver the comprehensive technology needed to build a registry that collects real-world data, transforms it into real-world evidence, and makes it accessible and useful for decision making.
There are a few ways medical device and pharmaceutical companies are using registries to support their post-market surveillance programs.
- Accessing data from an existing registry.
- Partnering with an existing registry that is running registry-based clinical trials.
- Leveraging registry technology to support a registry-based study.
- Creating new registries and using existing registry data to support a full post-market surveillance program.
Industry-Leading Registry Technology for Post-Market Surveillance
As medical technology and research continues to advance, the importance of tracking and reacting to real-world evidence through post-market surveillance will only continue to grow. Registries will play an integral part in this process, and their analytic potential will serve as an essential asset for patients, providers, and industry partners alike.
ArborMetrix offers an industry-leading, proven registry solution for post-market surveillance that meets the needs of medical device manufacturers, pharmaceutical companies, medical specialty societies, and clinicians.

9 Ways Real-World Evidence is Changing Healthcare

Real-world evidence, or RWE, is fundamentally changing the future of healthcare. Here’s how it happens:
- Real-world data (RWD) is aggregated and transformed into RWE through robust analytics.
- Real-world evidence (RWE) provides clinically-rich insights into what actually happens in everyday practice and why.
- Stakeholders across the healthcare ecosystem use this new knowledge to support decision-making and improve safety and effectiveness, and ultimately, patient outcomes.
Let’s take a closer look at RWD, how it becomes RWE, and the value of RWE across the healthcare ecosystem delivered through nine use cases.
In this post we will cover:
- What Is Real-World Data (RWD)?
- What Is Real-World Evidence (RWE)?
- Why Do We Need Real-World Evidence?
- Use of Real-World Evidence in Pharmaceutical and Device Companies
- Use of Real-World Evidence Among Regulators
- Use of Real-World Evidence Among Clinicians and Academic Researchers
- Use of Real-World Evidence in Healthcare Systems
- The Role of Registries in Generating Real-World Evidence
What Is Real-World Data (RWD)?
In order to understand real-world evidence and its role in healthcare, we must first define real-world data, or RWD.
Real-world data is any data that is collected in the context of the routine delivery of care, as opposed to data collected within a clinical trial where study design controls variability in ways that are not representative of real-world care and outcomes.
There are many different types and sources of RWD. Let’s take a closer look at each type, its source, and its uses.
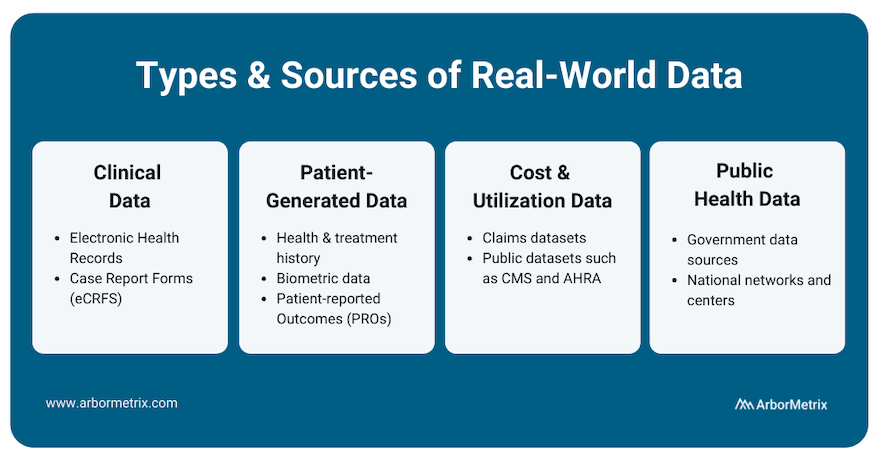
- Clinical data from electronic health records (EHRs) and case report forms (eCRFs). This data provide patient demographics, family history, comorbidities, procedure and treatment history, and outcomes.
- Patient-generated data from patient-reported outcome (PRO) surveys. These data provide insights directly from the patient, and they help researchers understand what happens outside of clinic visits, procedures, and hospital stays.
- Cost and utilization data from claims and public datasets. They provide information regarding healthcare services utilization, population coverage, and prescribing patterns.
- Public health data from various government data sources. These add critical information to enable stakeholders to best serve the needs of the populations they serve.
What Is Real-World Evidence (RWE)?
The U.S. Food and Drug Administration (FDA) defines RWE as “the clinical evidence regarding the usage and potential benefits or risks of a medical product derived from analysis of real-world data." [1]
Unlike traditional clinical trials, where necessary data elements can be curated and collection mandated, the creation of RWE requires assessing, validating and aggregating various, often disparate, sources of data available through routine clinical practice.
The creation of RWE requires a combination of high-powered analytics, a validated approach and a robust knowledge of available RWD sources (e.g. what data is captured within existing quality registries, what data can be captured through an EHR or claims, which patient organizations capture data on relevant patient cohorts).
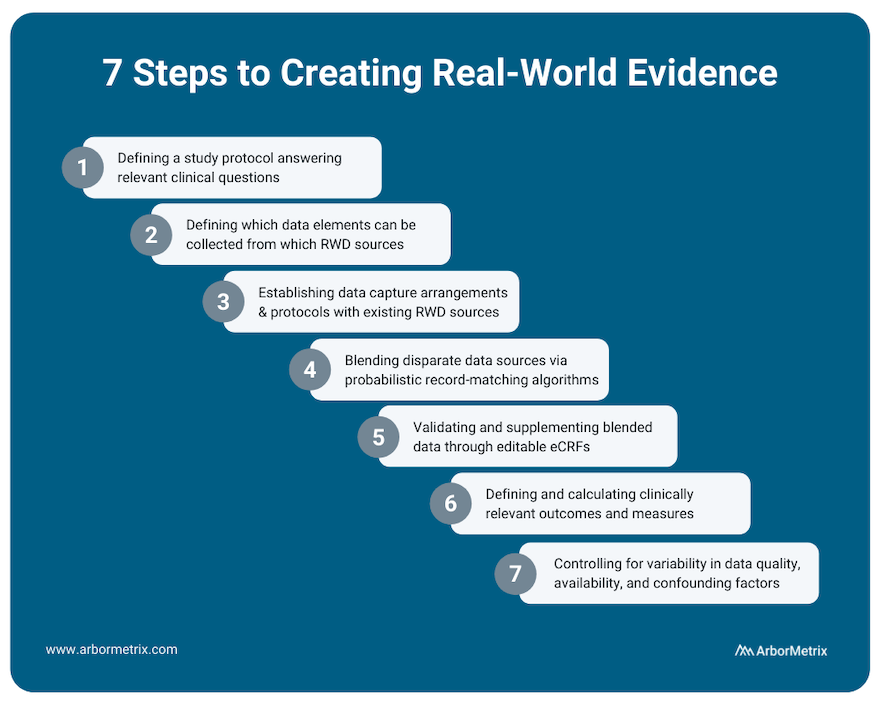
This process includes several steps:
- Defining a study protocol answering relevant clinical questions.
- Defining which data elements can be collected from which RWD sources.
- Establishing data capture arrangements and protocols with existing RWD sources.
- Blending disparate data sources through probabilistic record matching algorithms.
- Validating and supplementing blended data through editable eCRFs.
- Defining and calculating clinically relevant outcomes and measures.
- Appropriately assessing and controlling for variability in data quality, availability and confounding patient factors affecting measured outcomes.
RWE can provide a holistic view of patients that in many cases cannot be studied through traditional clinical trials.
Why Do We Need Real-World Evidence?
There’s a gap between research (what we learn) and everyday practice (what we do) in healthcare, and it creates a difference between what is expected to happen and what really happens.
But it’s what really happens that matters. Driving measurable improvements in healthcare requires us all to be rooted in the reality of what actually happens before, during, and after clinical procedures, interventions, and office visits.
RWE is here to fill those gaps and root us in truth. It tells us what really happens when doctors treat a wide range of patients that don’t look like the homogeneous patient groups in a clinical trial.
Because of this, RWE serves many uses and provides many benefits across the healthcare ecosystem.
Uses of Real-World Evidence in Pharmaceutical and Device Companies
Pharmaceutical and medical device companies are major consumers of RWE, as it can provide value across the entire product lifecycle.
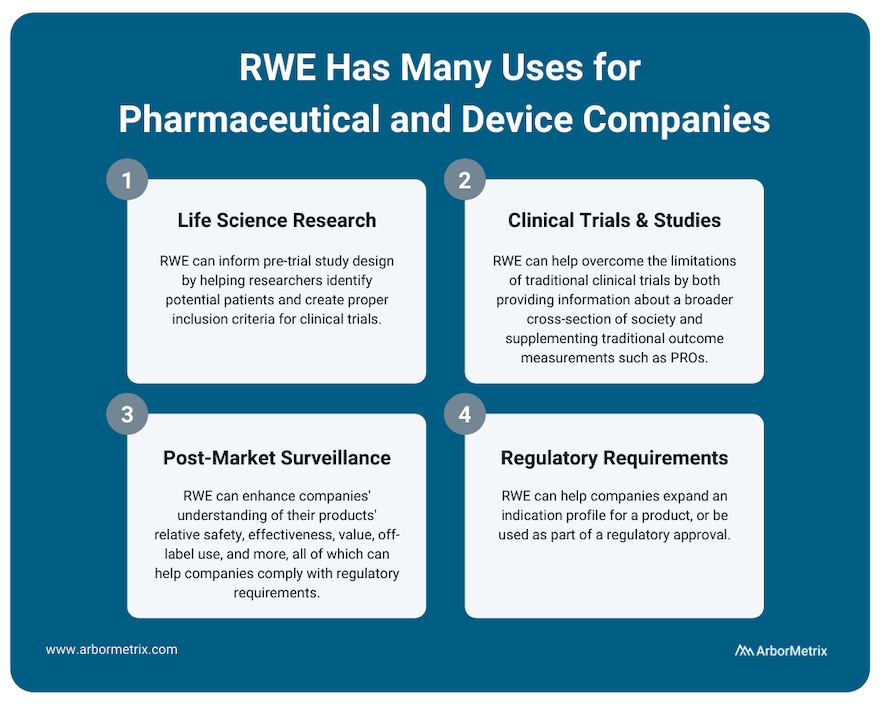
Use Case #1: RWE and Life Science Research (Pre-Trial Design)
RWE plays an important role for research across the product lifecycle for both pharmaceutical and device companies. It can inform pre-trial study design by helping researchers identify potential patients and create proper inclusion criteria for clinical trials.
Use Case #2: RWE and Clinical Studies and Trials
Much of medical innovation is driven by traditional clinical trials, where new pharmaceuticals and devices are rigorously studied and tracked before they can be sold and widely distributed. Although clinical trials are incredibly important to determine the safety and efficacy of new technologies, when compared to real-world evidence they do have some limitations.
For example:
- Traditional clinical trials can have strict inclusion criteria that makes it challenging for providers to accurately extrapolate the results of a clinical trial to a broader population.
- Clinical trial participation is often limited by who the study administrators are able to recruit, and various demographics are often not able to participate. This again challenges the generalizability of clinical trial results across patient populations.
Real-world evidence can help overcome the limitations of clinical trials by providing information about a broader cross-section of society. This can help clinicians, researchers, and industry partners better understand their products and how they work.
Also, during clinical trials, RWE can supplement traditional outcome measurements with patient-generated data such as patient-reported outcomes (PROs) or biometric data that is easier to collect between doctor appointments.
Use Case #3: RWE and Post-Market Surveillance
Once a product is approved and marketed, RWE can help a pharmaceutical or medical device company understand their products’ relative safety, effectiveness, value, off-label use and more. This post-market surveillance, or post-marketing surveillance, is valuable to stakeholders across healthcare. For example, we support several clinical data registries that provide real-time RWE that device manufacturers use to evaluate their products.
Purposes of this post-market surveillance may include:
- Detecting adverse events or risks as they arise during real-world usage of a device or drug.
- Comparing new products or treatments with existing options and the standard of care.
- Updating clinical guidelines as certain populations or groups find more benefit than others.
- Complying with regulatory requirements.
Use Case #4: RWE and Regulatory Requirements
RWE can help companies expand an indication profile for a product. For example, while it may not be feasible to perform a full clinical trial for a product that is commonly used for off-label indications, by collecting RWD from disease or product registries, companies may be able to study safety and outcomes data for their product or device, which can then be used to supplement a submission to the U.S. FDA or European Medicines Agency (EMA).
In addition, the U.S. FDA has indicated that for certain products, a promise of RWE analysis in the post-market period can be used as part of a regulatory approval. For example, it might not be feasible to run a clinical trial on a product that is to be implanted for a long period of time. In a case like this, post-market RWE can help provide that missing long-term data.
Uses of Real-World Evidence Among Regulators
Regulatory bodies like the U.S. FDA and the EMA are increasingly using real-world evidence, and in some cases requiring it, to satisfy post-market approvals.
Use Case #5: RWE and Post-Market Approvals
The U.S. FDA has provided a framework that provides insight and instruction on how to utilize RWE to support a new drug or device regulatory filing. [2]
They specifically note a few use cases where RWD and RWE can be utilized:
- Expanded label indications for a product or device.
- Post-market surveillance studies.
- Post-approval device surveillance as a condition of approval.
- Control groups for certain clinical studies.
- Supplementary data to help understand clinical trial data.
- Objective performance criteria and performance goals.
Uses of Real-World Evidence Among Clinicians and Academic Researchers
Use Case #6: RWE and Decision Support Tools
Through advanced analytics, RWE can provide individualized decision support tools that can facilitate shared decision-making between a patient and physician. For example, the Michigan Bariatric Surgery Collaborative uses a tool that predicts, based on individual characteristics, how a patient might respond to different types of bariatric surgery.
Use Case #7: RWE and Guideline Development
Through comparing outcomes for different treatment options, it might become evident that particular drugs or dosages are better optimized for different individuals, and treatment guidelines can be refined and optimized accordingly.
Use Case #8: RWE and Clinical Research
With large real-world datasets, researchers can perform observational, retrospective, and prospective studies that help academia advance its understanding of current therapies and technologies. Check out this list of research publications that use RWE from clinical registries to advance knowledge.
Uses of Real-World Evidence in Healthcare Systems
Use Case #9: Quality Measurement, Benchmarking, and Improvement
RWE can track outcome and quality measures across organizations. For administrators, RWE can provide information about how their entire health system is performing relative to others, and how their individual physicians are benchmarking relative to peers. This information can help inform coverage discussions with payers, and refine quality-based reimbursement strategies that reward solid outcomes.
The Role of Registries in Generating Real-World Evidence
Clinical registries, including patient, product and claims registries, not only provide a rich source of RWD. They are also critical tools for generating RWE itself and using RWE to support post-market surveillance and research.

What is Healthcare Benchmarking?

Striving to improve is always a worthwhile pursuit, but measuring your own improvement is only one piece of the healthcare quality puzzle. To see the full picture of the effectiveness of your efforts, you need to understand how you compare.
That’s where healthcare benchmarking comes in.
Benchmarking allows you to compare yourself or your organization to others and it is a critical component of successful quality and performance improvement. This is especially true in clinical registries where benchmarks aren’t about rankings, but rather, achieving real-world results.
Let's dive into the basics of healthcare benchmarking in registries.
In this post we will cover:
- What Is Healthcare Benchmarking and Why Does It Matter?
- How Do You Benchmark Healthcare Performance?
- What Are Examples of Healthcare Benchmarking?
What Is Healthcare Benchmarking and Why Does It Matter?
Put simply, benchmarking in healthcare means comparing the performance of an organization or clinician to others.
The goal of benchmarking in registries is to improve quality, efficiency, and patient experience. Accurate comparisons and fair benchmarking are critical components of successful quality improvement initiatives.
When it comes to registries, benchmarks are highly valuable for individual sites or clinicians.
Your registry participants can use benchmarks to understand how they compare to others and why. Benchmarks can help orient their organization in the broader healthcare landscape. They’ll not only understand where they rank — at the bottom, middle, or top of the pack — but also understand why.
Benchmarking allows hospitals and practices, individual clinicians, and other healthcare organizations to monitor their own performance, compared to their de-identified peers, as applicable. Benchmarks can be applied to metrics about patient characteristics, volume, processes, outcomes or other meaningful categories.
How Do You Benchmark Healthcare Performance?
One way we approach benchmarking is through our reporting framework.
We look at:
- Descriptive Statistics: Who makes up my population?
- Process and Adherence: What am I doing?
- Outcomes: What are my outcomes?
- Comparison: How do I compare?
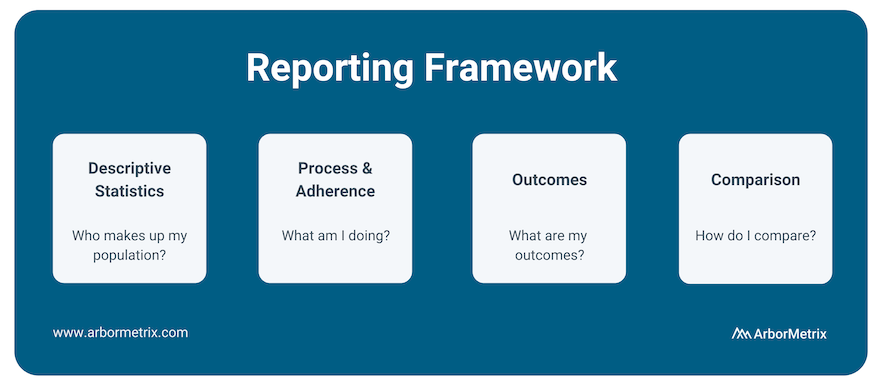
After understanding the basics of your data, what initiatives you’re undertaking regarding process and adherence, and what your outcomes look like, benchmarking your metrics against your peers is the next crucial step.
Comparison has always been a key component of our analytics and reporting framework because it uncovers opportunities to improve.
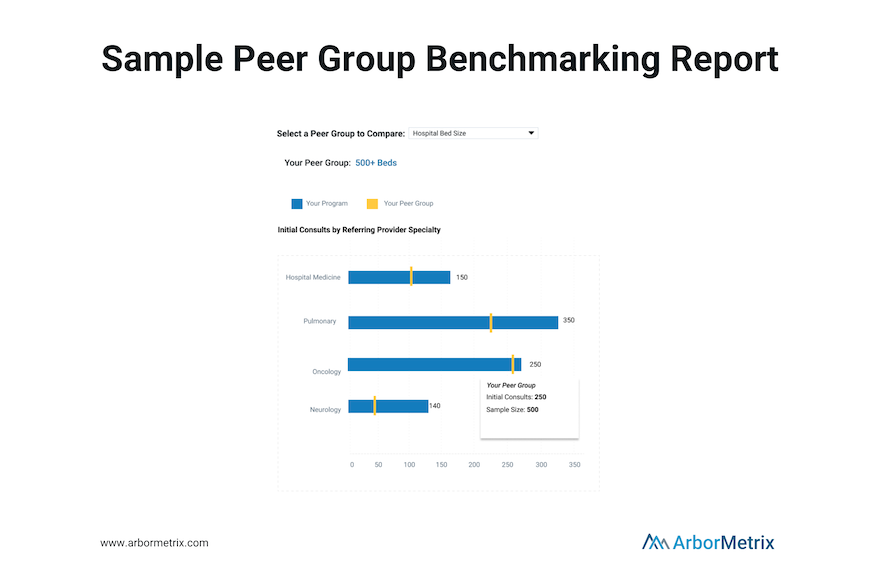
We provide reporting and peer benchmarking capabilities at the clinician, practice, multi-practice, multi-facility, and organization levels. This enables organizations to compare individual clinicians or practices/sites to the appropriate benchmark.
To accurately analyze benchmarks, you need to clearly articulate both what metrics you are comparing and what organizations you are using as comparisons.
Metrics of interest for healthcare benchmarking include:
- Mortality rates
- Length of stay
- Readmissions
- Postoperative complications
- Patient wait times
- Adherence to established protocols, such as hand washing
- Patient satisfaction
- Pharmaceutical side effects and outcomes
- Outcomes following the use of medical devices
Comparison metrics are most accurate with a proper comparison group, also called a peer group. A peer group is a group of individuals or entities that share similar characteristics and interests among one another. Importantly, peer groups allow organizations to compare themselves to other, similar organizations.
To accurately identify your peer group, consider the following characteristics of healthcare organizations and practices:
- Bed size
- Procedure volume
- Provider volume
- Practice type (Private Practice, Academic/Research Hospital, Healthcare System, Outpatient Lab, Federal Government Facility)
- Private practices
- Geographic type (e.g. urban, rural suburban)
- Teaching hospital
- Department
- Single-specialty vs. multi-specialty
- Region
Benchmarking is a key competency of all reporting in our registries. We make the process simple by configuring specific groups for aggregation and benchmarking for you. The benchmark groups available to you can be managed through your administrative dashboard and you can modify them at any time. We include an organization-wide ‘All’ benchmark, as well as the ability to create peer groups of custom benchmarks. You can visually compare your organization’s performance to any benchmark, and benchmark values are color-coded on reports to allow for ease of use.

What Is Quality Improvement in Healthcare?

Quality improvement in healthcare delivery benefits everyone — from patients and clinicians to hospitals, payers, and life science organizations. Patients have better outcomes, clinicians make evidence-based decisions, hospitals and payers achieve financial efficiencies, and life science organizations develop safer products.
To achieve these goals, you need a solid understanding of what quality improvement is, who contributes, why it matters, and how to evaluate and track your progress.
In this post we will cover:
- What Is Quality Improvement in Healthcare and Why Does It Matter?
- Who Contributes to Healthcare Quality Improvement?
- How Do You Evaluate Healthcare Quality?
- How Do You Achieve Quality Improvement?
- Quality Improvement Projects in Healthcare
What Is Quality Improvement in Healthcare and Why Does It Matter?
Quality improvement is measurable progress toward better patient care and outcomes.
What might quality improvement look like in practice? Examples include:
- Reducing adverse events
- Preventing unnecessary hospitalizations
- Developing safer health products and devices
- Achieving financial efficiencies and savings
- Improving patient quality of life
- Making evidence-based care decisions
Put simply, quality improvement matters because it benefits everyone. Without quality improvement efforts, clinical patient care, pharmaceutical research and development, and medical device innovation would struggle to advance. Additionally, many value-based care programs and other forms of healthcare reimbursement are linked to quality improvement.
Quality improvement is a crucial goal for any healthcare organization. To get better, you need to know where you stand, how you compare, and what you can do to improve.
Who Contributes to Healthcare Quality Improvement?
Healthcare quality improvement requires buy-in and cooperation from a diverse group of healthcare stakeholders.
- Clinicians and providers are integral to providing care that is safe, efficacious, and has value.
- Patients and caregivers are vital to healthcare quality through providing feedback through patient-reported outcomes (PROs) programs to help improve quality of care.
- Hospitals, health systems and practices are fundamental as they provide the structural foundation and systems needed to foster an ecosystem of quality.
- Payers ensure that providers are compensated fairly and equitably for high-quality care and can drive improved outcomes in a value-based care system.
Other stakeholders in the healthcare quality ecosystem include pharmaceutical companies and medical device organizations, which improve healthcare through providing safe and effective interventions. Non-profit organizations and agencies are also tasked with overseeing and promoting quality practices.
And, last but not least, specialty societies, associations, and collaborative quality initiatives are essential to evaluating quality through the development and implementation of quality measures and often steward clinical data registries that are the hub of quality improvement practices.
Achieving quality improvement at scale requires bringing multiple clinicians, sites, and patients together with a common goal. This is often achieved through the help of a robust data infrastructure, such as a clinical registry, that can support numerous and evolving quality initiatives.
How Do You Evaluate Healthcare Quality?
Although there are many ways to assess and achieve healthcare quality, attaining quality improvement at scale is made easier with an advanced clinical data registry.
Registries collect, organize, and display information with the purpose of evaluating and improving outcomes. Combined with rigorous analytics, clinical registries can point to areas for improvement, identify best practices, and help make informed decisions to reach your quality goals.
Specifically, clinical data registries track information about the health status of patients and the care they receive. They bring together large data sets and analyze trends or patterns in treatments and outcomes to help inform best practices, guidelines, treatment decisions, and more.
Check out this post to learn more about clinical data registries and how they can be leveraged to achieve real-world quality improvement: The Basics of Clinical Data Registries
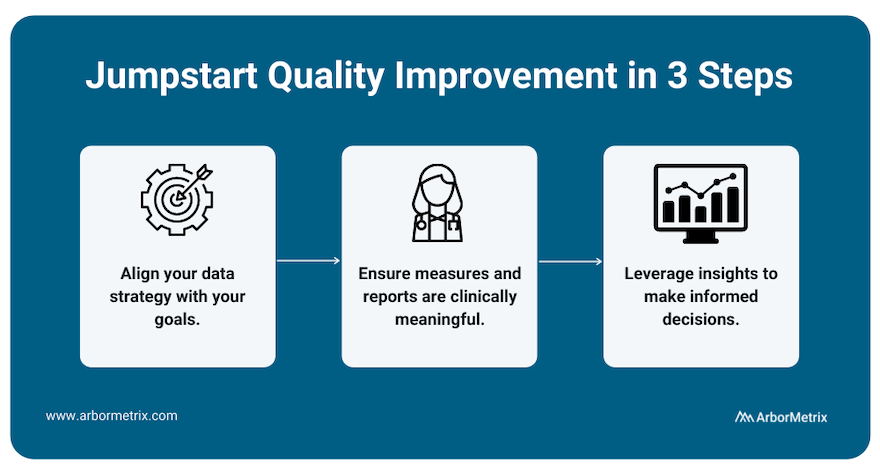
To best measure quality and achieve improvement, we recommend working with a registry technology partner through a three-step process.
- Align your data strategy with your goals.
Before building a registry for quality improvement, you need to define your goals. What would you like to improve? What would success look like? With the end in mind, you can then pull together relevant data from many sources in one place to produce reliable insights for decision-making.
- Ensure measures and reports are clinically meaningful.
Making real progress requires clinician engagement. By including clinicians and tracking measures that affect real-world clinical quality, you can facilitate evidence-based comparisons that catapult quality improvement efforts.
- Leverage insights to make informed decisions.
With high-quality data, you gain access to high-quality insights, which you can then use to make informed decisions that are rooted in validated, accurate data and rigorous analytics. Put simply, when you have insights you and others trust, you can identify the best path to quality improvement.
Check out this post to learn how the long-term success and sustainability of a registry are affected by several decisions: How to Define Success for Your Clinical Registry
Evaluating healthcare quality improvement requires a nested, multifaceted approach with stakeholders being accountable to one another while servicing their own needs.
Hospitals, health systems, and practices provide the structural backbone of quality, and are necessary for the success of quality improvement for clinicians, pharmaceutical companies, and medical device manufacturers.
All quality improvement efforts rely on a backbone of measurement, data collection, and implementation that optimizes clinical workflow and evaluation of quality is best achieved through the registry.
Evaluating Quality for Clinicians
To improve care quality, clinicians need to be able to:
- Measure and understand their own clinical performance.
- Optimize decision-making with the right information at the right time.
- Drive real-time interventions through predictive analytics.
- Act on performance feedback quickly and decisively.
- Identify best practices and make evidence-based decisions.
- Provide value through performance measurement coupled with technology and systems for improvement.
Clinicians achieve quality improvement when patients have better care, better outcomes, and better quality of life. With the right tools, such as an advanced clinical data registry, clinicians can easily track, measure, and compare their quality of care.
Evaluating Quality for Hospitals, Health Systems, and Practices
Large healthcare organizations such as hospitals and health systems also strive to improve care for patients, but their measures of quality improvement differ slightly from clinicians.
To achieve measurable quality improvement, hospitals should:
- Succeed in value-based care models, such as bundled payment and other at-risk reimbursement programs.
- Optimize financial performance.
- Empower and engage clinicians with real-time performance feedback and other vital information that drives results.
- Deliver high-value patient care as efficiently as possible.
- Manage resources, reduce costs, and improve outcomes across episodes of care.
- Drive real-time interventions and optimize clinical workflow with predictive analytics.
Hospitals and health care systems are integral in the quality improvement process and participate in a variety of ways. Clinical registries are essential in the data collection process to fulfill the requirements for many quality indicators and therefore be the vector for quality improvement.
Additional common quality improvement tools for hospitals include:
- AHRQ (Agency for Healthcare Research and Quality) Quality Indicators
- National Hospital Quality Measures
- CAHPS Hospital Survey
- The Joint Commission ORYX®
- The Leapfrog Group’s Measures
Evaluating Quality for Pharmaceutical Companies
For pharmaceutical companies with products and medications on the market, understanding those products’ effectiveness and safety in the real world is key, and can help buttress quality improvement efforts.
For quality improvement efforts to be successful, pharmaceutical companies must:
- Evaluate product effectiveness in large, diverse patient groups.
- Identify risks, complications, and adverse outcomes as they arise.
- Compare new products with existing options and the standard of care.
- Update guidelines as certain populations or groups find more or new benefits.
- Comply with regulatory requirements.
- Enhance product safety and efficacy.
Evaluating Quality for Medical Device Manufacturers
Quality improvement for medical device manufacturers relies on real-world evidence. To improve, you must understand how your device performs in the real world, with real patients—and how it compares to existing options and the standard of care. Registry-supported research and post-market surveillance can improve quality throughout the product lifecycle, further enhancing the efficacy and safety of medical devices.
More specifically, quality improvement efforts can help:
- Address risks, complications, and adverse outcomes.
- Establish a new standard of care.
- Update usage guidelines.
- Comply with regulatory requirements.
- Ensure your devices perform optimally in real-world settings.
- Accelerate your path to value.
Device registries are powerful tools for assessing device safety, efficacy, and value, and ultimately delivering high-performing products to patients.
How Do You Achieve Quality Improvement?
Implementing and scaling healthcare quality improvement can be summed up in the three phrases that are integral to ArborMetrix’s (and our customers’) success: Specify, Measure, Act.
Learning health systems, medical specialty societies, and collaborative quality initiatives all depend upon the foundation of registries to manage quality improvement at scale and follow this same methodology.
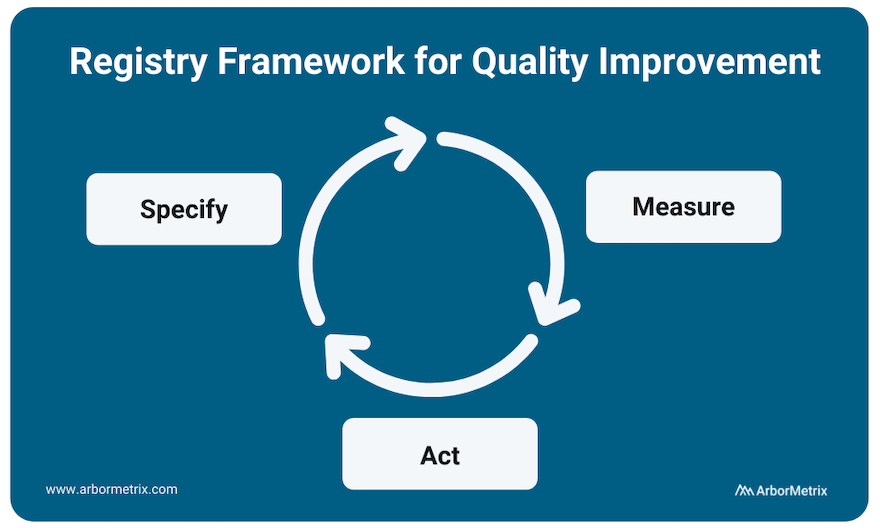
Specify
The clinical data registry is the workhorse of the specification phase of quality improvement. Breaking down metrics into actionable items and collecting the necessary data to track them is integral to any successful quality improvement program.
Data specification and collection happens through many modalities including patient-reported outcome surveys, as well as collection of efficacy data as related to interventions like drugs and medical devices.
Measure
All quality improvement requires robust measurement through determining and prioritizing problem areas that need improvement and creating metrics to track these areas.
Measurement begins with using existing data and research to understand problems and analyzing gaps in care. It occurs at every level of healthcare quality including clinician performance improvement programs such as MIPS, health system-based programs such as HEDIS, and AHRQ quality indicators. Measurement also occurs at industry level, in post-market surveillance and the FDA Pharmaceutical Quality System.
Act
Using the insights gained from the data collection process to act and make changes in your processes is the final step in the quality improvement process.
However, quality improvement does not stop here. The quality improvement process is continuous, and your results should be used as your new baseline data for building ongoing quality improvement processes. This includes sharing performance feedback with clinicians and hospitals, sharing ratings with patients, and disseminating information to the broader medical community.
Collecting additional data and measuring adherence and outcomes in real-time accelerates the process and builds a canon upon which clinical guidelines are developed.
Quality Improvement Projects in Healthcare
Quality improvement can result in a host of benefits — clinical, procedural, financial, and more. Here are a few organizations that have achieved significant accomplishments as a result of their quality improvement projects and initiatives. They each deploy a modern data infrastructure through their clinical data registries to support data-driven action.
Project: Enhancing Prostate Biopsy Safety
The Michigan Urological Surgery Improvement Collaborative (MUSIC) is a clinician-led quality improvement collaborative comprised of a network of urology practices. They use a clinical data registry to support various quality initiatives.
One of MUSIC’s earliest quality improvement projects aimed to enhance the safety of prostate biopsy. Specifically, the collaborative focused on “reducing the frequency of adverse events after transrectal ultrasound guided prostate biopsy as a diagnostic tool for prostate cancer.” MUSIC leveraged registry data and its collaborative to identify the key to reducing the majority of prostate biopsy related hospitalizations. They developed two specific treatment pathways and introduced them via the MUSIC Biopsy Pathway Protocol.
Data in the MUSIC registry demonstrated a nearly 50% reduction in prostate biopsy-related hospitalizations since the start of their QI initiatives in this area.
Project: Improving Outcomes for Children with Critical Heart Conditions
The Pediatric Cardiac Critical Care Consortium (PC4) is one of five founding organizations of Cardiac Networks United (CNU), a national network of physicians and pediatric hospitals that aims to advance pediatric congenital heart disease care and outcomes. More specifically, PC4 aims to improve the quality of care for pediatric heart patients through transparent data sharing that allows hospitals to evaluate their own outcomes and learn best practices.
Their efforts are proving effective and the results are outstanding. Eighteen hospitals significantly reduced mortality (by ~24%) and improved care for children with critical heart conditions, according to a paper published in the December 2019 edition of the Journal of the American College of Cardiology. The study analyzed more than 19,000 hospitalizations that included cardiac surgery at the participating sites in the PC4 registry.
Project: Reducing Readmissions and Emergency Department Visits
The Michigan Bariatric Surgery Collaborative (MBSC) is a quality collaborative that improves the science and practice of metabolic and bariatric surgery through patient-centered obesity care.
One of MBSC’s recent quality improvement projects, called M-PIRRE, aims “to identify and address the underlying causes of avoidable ED visits, then design and implement site-specific evidence-based interventions to reduce them.”
MBSC has developed a four-phase program that involves developing a patient ED questionnaire, analyzing patient-provided data, designing and implementing site-specific intervention plans, and measuring the impact of those plans. MBSC will create a “universal toolkit based on successful evaluations of underlying causes and interventions to eliminate them” and, ultimately, “reduce ED visit rates among sites and MBSC as a whole.”
Check out this post for additional examples of quality improvement achieved through clinical registries: Top Examples of Quality Improvement through Clinical Registries

How to Preserve Data Quality in Healthcare When Working with Big Data Sets

A clinical registry is only as valuable and impactful as its data is trusted and usable.
High-quality data is the foundation of any clinical data registry, yet it does not develop on its own. In the world of healthcare, we have millions of unique data elements of different sizes, formats, and characteristics.
Before we get into the process of achieving high quality data, let’s start with a brief definition.
What Is High-Quality Data in Healthcare?
Characteristics of data quality include data that is precise, validated, and comprehensive. These characteristics provide valuable assets to meet the evolving data requirements of varied healthcare stakeholders.
Acquiring data from various sources is the first step. The necessary and important next step is to take all the data blocks and build something grand, nimble, and valuable.
Data Integrity Process in Healthcare
In order to preserve and extract data value, you need a solution that is centered around a multi-layered data integrity process. This is of paramount importance for registry activities.
Multi-layered data integrity processes enable comprehensive, persistent, and widespread data integrity protocols that protect registry data and reporting in serving the needs of diverse stakeholders.
There are five methods for perpetually protecting data integrity
Data Review & Validation
Whenever connecting to a new data source, EHR system, or modifying an existing source, registries should engage in a thorough analysis to assess data integrity across several domains:
- Completeness: Is the data element available and populated?
- Concordance: Do the values of the data element agree with those of related variables?
- Plausibility: Do the values of the data element make clinical sense?
- Currency: How recent is the available data?
Comprehensive Validation
It is critical to preserve data quality throughout the life of a registry. The best way to accomplish this is through real-time and ongoing data validation checks that deliver the following components.
- Validation Rules: Each data integration interface should be configured to include robust and comprehensive validation rules that ensure only valid records enter the registry.
- Data Quality Reporting: Dedicated registry dashboards should provide registry participants with real-time information on their data quality across dimensions such as completeness, concordance, plausibility, and currency.
- Systems Monitoring and Alerting: Real-time monitoring and alerting tools should report any unexpected data events during the data processing. Alerts should go to the right stakeholders for immediate action and resolution. For example, a practice might receive an alert that their most recent data included data elements outside of normal ranges.
Using this multi-layered strategy ensures that all registry data is efficiently ingested, transformed, persisted, and analyzed while maintaining complete fidelity to the original clinical record.
Documentation and Transparency
A registry is only as valuable as it is trusted. Registry stakeholders need to feel confident interacting with their data and interpreting its results. Thus, all data transformations need to be fully documented and approved.
This includes documentation of data processing rules, data validation logic, and measure calculations. This information provides full transparency into how data is used in the registry and helps to increase trust in the clinical insights generated from the registry.
Change Management
Registries will evolve and grow as new priorities emerge – from new data elements being added to changes in measure calculations. These updates increase the value of the registry, but in the process, they must not interrupt current data protections that might affect registry results and further confuse users.
Any data change should go through a systematic change control process to transparently document, test, and have approved any update so its impact is known and widely shared prior to implementation.
Data Logging and Auditing
Health data is sensitive and requires data protections to ensure it is responsibly handled. Furthermore, registry engagement will lead to numerous questions from registry stakeholders on how data was processed and handled. All data entering the registry must be fully traced from the receipt of data to when it is displayed on reports.
This includes auditable logs of all activity related to data submission, data manipulation, and registry interactions. Each data element underlying the registry is tied to information on the date of receipt, data submission protocols, date and time, data quality results, data transformation steps, and the capturing of raw source data for comprehensive auditing and tracking.
Dedicated Team
Data integrity is best protected when the above processes are controlled by data experts who are intimately familiar with the registry data, goals, and stakeholders. Projects should have a dedicated team of data scientists, data engineers, and data integration specialists who provide long-term, end-to-end registry support through their extensive knowledge of all aspects of the project.
Achieve High Data Quality with Your Registry
Data quality is essential to registries because it establishes trust and value. When your clinicians, researchers, and other stakeholders are confident in the data, they can use it to advance research and improve outcomes.

Understanding Clinical Registry Data Types & Data Sources

Building a successful clinical registry is a three-step process that involves acquiring data, transforming it with advanced analytics that identify what matters, and informing clinicians and other stakeholders what and how to improve.
Let’s focus on the first step: acquiring data. For a high-achieving registry, you need to collect a large amount of quality data.
Data for your registry can come from a variety of sources, such as medical records and health insurance claims. Regardless of the source, you need to be sure that the data you’re collecting will both enhance your registry and help you meet your registry goals.
With so much data available, it’s easy to feel overwhelmed. As long as you keep your focus on your goals, you’ll be able to compile a healthy dataset that will serve your organization’s purposes successfully.
Let’s explore the various data sources you can use to build your registry.
In this post we will cover:
- Clinical Data
- Patient-Generated Data
- Cost & Utilization Data
- Public Health Data
For each, we’ll define what it is, where and how to acquire it, and address any common challenges or limitations of the data source.
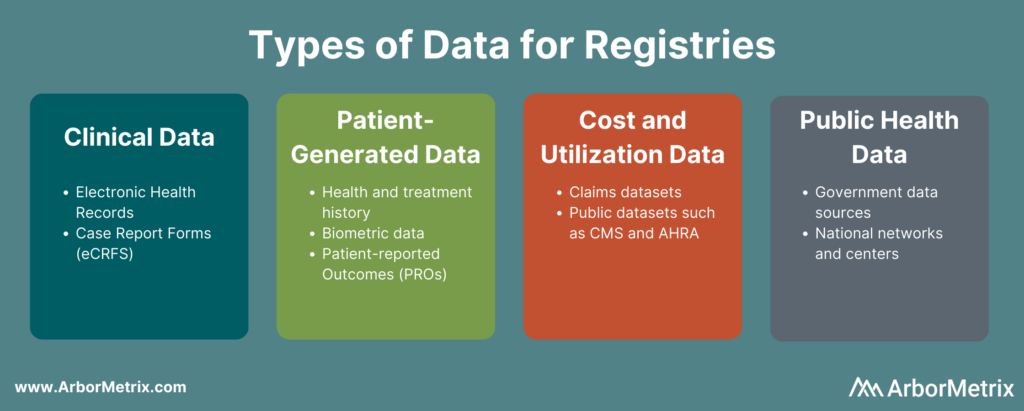
Clinical Data
Clinical data is at the core of many registries. It has a powerful ability to summarize clinical experiences and capture information needed to inform healthcare progress.
What Is Clinical Data?
Clinical data helps establish who a patient is – their demographics, family history, comorbidities, procedure and treatment history, and outcomes. The breadth and depth of clinical data opens up opportunities to advance quality improvement initiatives, research, registry-based studies and virtual trials, and other stakeholder activities.
Sources of Clinical Data
The key source of clinical data resides in a patient’s medical record, which collects nearly all care delivery and treatment decision details, regardless of treatment setting. The record resides in outpatient and inpatient facilities and contains information from various ancillary services, such as chemistry labs, pathology or radiology departments, and pharmacies.
Because a patient’s medical record aims to show as complete a picture of the patient as possible, the data abstracted from those records is often more comprehensive than data from other sources. Additionally, medical records follow patients over time, allowing registries to collect and analyze longitudinal information. Medical record data is therefore extremely valuable to budding registries.
Collecting Electronic Health Record Data for Registries
Medical record data can be highly useful, but gaining effective access to that data isn’t always simple.
For clinical registries, successful medical record data acquisition relies on the combined effectiveness of trusted relationships with the record stewards and technologies used to transmit data, such as electronic health record (EHR) systems.
The vast majority of hospitals in the United States use electronic health records (EHRs). There are many different EHR vendors, which can cause difficulties with data sharing. Given the variety of EHR solutions and the varying policies at different sites, having a flexible data integration approach for your registry is key.
Here at ArborMetrix, we integrate with hospital and clinic EHRs and other data systems with minimal impact to IT and clinical resources. Whether healthcare organizations use cloud-based EHR systems, custom-defined layouts, or anything in between, our registry data platform seamlessly collects the necessary data.
We support industry standards for interoperability, as well as custom data formats. Industry standards such as HL7 FHIR® and C-CDA serve to bridge documentation from disparate EHRs in ways that facilitate data aggregation across populations.
Limitations of EHR Data for Registries
Sometimes, data collected in EHRs lacks the clinical specificity needed for quality improvement and research done through registries.
Many EHRs are not configured to collect the details on the high resource intensive conditions. This leaves the data with gaps that prevent it from being used to make impactful changes in care delivery. Consequently, there is the need to supplement the EHR data with specialized and targeted assets required for real clinical improvement.
Some registries use technology-enhanced clinical abstraction to address this and create a more complete dataset. For example, our electronic case report forms (eCRFs) allow registry participants to enter cases on-site or remotely. Once all the required data have been entered into the system, data analytics and dashboard reports are available immediately.
Leveraging eCRFs to fill any gaps in EHR data creates more complete data set.
Patient-Generated Data
Driving high-value healthcare often requires data that goes beyond an exam room or treatment facility. Your registry can generate many healthcare insights through patient-generated data.
What Is Patient-Generated Health Data?
Patient-generated health data (PGHD) “are health-related data created, recorded, or gathered by or from patients (or family members or other caregivers) to help address a health concern,” according to the National Learning Consortium at HealthIT.gov. [1]
A few examples of patient-generated data include a person’s health and treatment history, symptoms, biometric data, and patient-reported outcome measures.
Sources of Patient-Generated Data
A core source of patient-generated data comes from patient-reported outcomes (PRO). PRO are health data sourced directly from patients, without any interpretation or alteration by a clinician or other individual.
Because inpatient documentation in the hospital medical record stops when patients are discharged or transferred, and outpatient documentation occurs longitudinally but is sporadic and only captures new data clustered around patient encounters., Adequately capturing patient data outside of the walls of a hospital or outpatient clinic requires PRO.
Collecting PRO Data
A user-friendly PRO solution encourages patients and caregivers to share details of their experiences, quality of life, and outcomes in ways that extend the period of data acquisition following inpatient care. It also fills the gap in patient communication between outpatient encounters.
Important pieces of information that come from PRO include:
- Type, frequency, and severity of symptoms
- Nature and severity of disability
- Impact of condition on daily life
- Patients’ perceptions and feelings about their conditions and/or treatments
Including PRO in their registries can help healthcare organizations track outcomes, support shared decision-making, develop guidelines, inform best practices, and calculate predictive analytics.
Usually, organizations acquire PRO data through surveys and other technology-enabled digital platforms. Other sources of patient data include wearables, population health measures, and patient registries.
Challenges of Collecting PRO Data
A question that sometimes comes up with PRO data is whether it is accurate. Fortunately, research shows a high correlation between patient-reported data and clinically documented chart abstracted data. [2] This means data collected from patients is accurate and trustworthy.
A second potential challenge in collecting PRO data involves patient engagement. Patients who are engaged in their care can share information and communicate more easily with their caregivers, making PRO acquisition much more effective.
Organizations that have successfully engaged patients have employed a few helpful tactics, including:
- Treating patients like consumers, by making surveys and feedback platforms responsive and user-friendly.
- Recognizing the role of technology to help meet patients where they are at with a simple and effective survey experience.
- Delivering a tailored experience so surveys can be customized to different patient populations and flexible and responsive to their unique needs.
- Being creative and compelling by giving patients and their families access to other resources, such as a shared decision-making platform.
Collecting PRO Data from Patient Devices
Other patient-generated data sources include passive data collection from patient devices, such as wearables or smart healthcare electronics. These systems often have data connectivity tools, such as APIs, to security transfer patient data points to a registry platform. Real-time, streaming data can further augment information gathered from PRO surveys and clinical data systems, without burdening patients or providers.
Cost & Utilization Data
Many healthcare and clinical registry pursuits are driven by value-based care initiatives — improving outcomes while controlling for costs. These programs require measuring health outcomes against the cost of delivering those outcomes.
What Are Cost & Utilization Data in Healthcare?
Cost and utilization data helps to assess care value for preventing and treating health problems.
Healthcare cost has a specific meaning, but its “interpretation often depends on whose perspective is being considered.” According to the AMA Journal of Ethics, the definition of cost means:
- To providers: the expense incurred to deliver health care services to patients.
- To payers: the amount they pay to providers for services rendered.
- To patients: the amount they pay out-of-pocket for health care services.” [3]
Healthcare utilization “refers to the use of healthcare services. People use healthcare for many reasons including preventing and curing health problems, promoting maintenance of health and well-being, or obtaining information about their health status and prognosis,” according to the Encyclopedia of Behavioral Medicine. [4]
Sources of Cost & Utilization Data
Key sources of cost and utilization data are collected by health insurers, governmental organizations, and public payers. They include claims data regarding patient treatments, as well as public datasets from organizations like the Centers for Medicare and Medicaid Services (CMS) and the Agency for Healthcare Research and Quality (AHRQ).
Payer and regulatory data are especially useful for registries examining the economic aspect of healthcare. Specifically, by including these types of data, registries can more easily perform cost and quality analyses due to the clear records of a patient’s treatment history. Also, especially for government data, the dataset may be larger-scale and include information from a broader patient population.
These data can be acquired from private and public health insurers, and many regulatory datasets are available for public use directly from the sponsoring governmental agencies. For example, we use the Healthcare Cost and Utilization Project (HCUP) dataset from AHRQ and the Limited Data Set from CMS to calibrate propensity-score-based risk adjustment models and to provide external benchmarks for our registry clients such as the Michigan Value Collaborative.
Challenges with Healthcare Cost & Utilization Data
While cost and utilization datasets can be extremely valuable, they also have their limitations.
Dealing with claims data, whether they come from commercial or public payers, can be subject to reversals and adjustments, completion lags, and coding variation and changes that can present considerable challenges when incorporating such data into a new registry.
Overcoming these challenges requires registries to use sophisticated analytic tools and have deep expertise with payer and regulatory data.
For example, we developed and use an elastic episode-based model that lends itself to more appropriate assessments of longitudinal cost. Our model also allows us to more fully assess the outcomes of medical treatments by looking at longitudinal episode cost across a variety of conditions, settings, and care types. This approach captures episodes of care, episodes of illness, and health maintenance episodes to illustrate cost effectiveness across a variety of components. Through this model, we can track care in systematic ways to make comparisons on cost and outcomes.
Public Health Data
There are a variety of factors that significantly influence healthcare outcomes, with clinical care and patient health behavior only representing a portion of the influences. Up to 50% of health outcomes are contributed to community and population health factors. [5]
Consequently, efforts to advance health care requires a full view of all factors that influence health outcomes. This view is critical to understanding the pathways to advance the direction of health care.
Registries can be powerful for providing data to understand the multitude of pathways influencing patient health and using that data to support the development of evidence-based clinical interventions, community guidelines, even advocacy for policies and regulations.
Sources For Public Health Data
There are numerous public health data assets for evaluating community and population health factors. Government data sources are easily available and can layer valuable information on the prevalence and severity of health conditions across different populations in a community. Some sources of public health data include:
- Behavioral Risk Factor Surveillance System (BRFSS): Includes data at the county and census tract-level related to health outcomes, clinical care, and health behavior.
- National Center for Chronic Disease Prevention and Health Promotion’s (NCCDPHP) Chronic Disease and Health Promotion Data and Indicators Open Data Porta: Includes numerous data access tools across a wide range of chronic disease data, risk factor indicators and policy measures.
- National Center for HIV/AIDS, Viral Hepatitis, STD, and TB Prevention – NCHHSTP AtlasPlus: Includes more than 15 years of CDC’s surveillance data on HIV, viral hepatitis, STD, and TB. AtlasPlus also provides access to indicators on social determinants of health (SDOH) allowing users to view social and economic data in conjunction with surveillance data for each disease.
- National Environmental Public Health Tracking Network: The National Environmental Public Health Tracking Network (Tracking Network) brings together health data and environment data from national, state, and city sources.
- CDC National Vital Statistics System (NVSS): Includes health outcome data, such as mortality rates by cause of death at the county level.
- CDC Wide-ranging Online Data for Epidemiologic Research (CDC WONDER): Includes nearly 20 collections of public-use data for U.S. births, death, cancer diagnoses, tuberculosis cases, vaccinations, environmental exposure, population estimates, among other topics.
- USDA Economic Research Service (ERS) – Food Access Research Atlas: offers census-tract-level data on food access that can be downloaded for community planning or research purposes.
Public health data sources add critical information to registry systems to enable registry stakeholders to best serve the needs of the populations they serve. Public health and clinical information can be blended together within a single registry to have a comprehensive, multi-factorial view of health. This creates a platform that can best fulfill the meaningful and diverse healthcare objectives registries pursue.
Set Your Registry Up for Success
Whether you’re building a condition-specific registry for quality improvement or expanding your registry to address new research priorities, you need to be thoughtful about what data you include. Further, you need the tools, expertise, and technology to ensure your registry can achieve your goals.

What Are Risk and Reliability Adjustment and Why Do They Matter?

Measuring clinical performance is challenging. Some patients are older or sicker; some have more advanced clinical conditions. Measurement populations are rarely large enough to eliminate chance. To accurately measure clinical performance, you need to control for these confounders and mitigate the role of chance. You need accurate measurement of outcomes, processes, and costs to meaningfully improve the quality and efficiency of care delivery. You also need to be able to compare the performance of different providers to one another and track changes over time.
To that effect, there are three key technologies that are essential to success in measuring and improving performance in healthcare: risk adjustment, reliability adjustment, and on-demand performance feedback.
In this post we will cover:
- Risk and Reliability Adjustment in Healthcare: The Basics
- Risk Adjustment Methods
- Reliability Adjustment Methods
- On-Demand Performance Feedback
Risk and Reliability Adjustment: The Basics
Let’s start out with a simple equation:
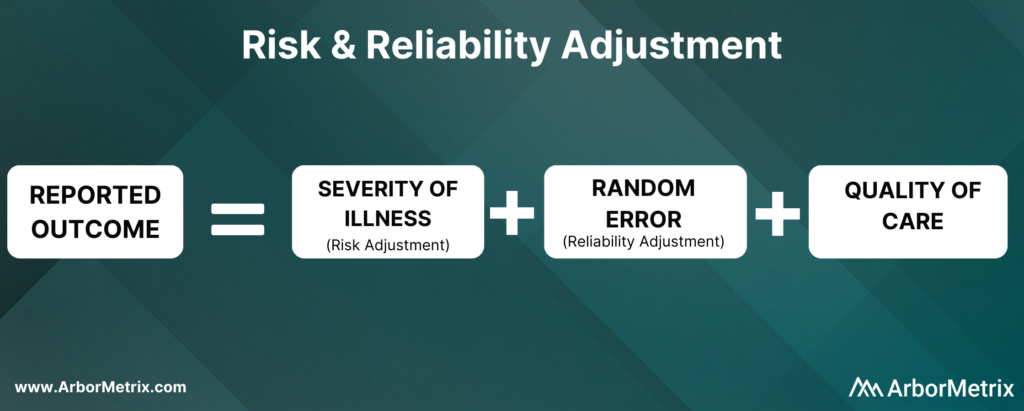
Now, let’s break this equation down and define each component.
What Is Risk Adjustment?
Risk adjustment is a process that corrects for the severity of a patient’s illness. In other words, adjusting for risk levels the playing field and ensures that comparisons of hospitals and clinicians are fair and accurate.
Why Is Risk Adjustment Important?
Some hospitals and clinicians treat more high-risk patients than others. Because of that, comparing a metric like mortality rates between two different hospitals isn’t always helpful, because one hospital is working with much more severely ill patients than the other.
In short, it’s challenging to compare outcomes like complications, utilization, and mortality rates for patients with the same condition but different health statuses.
That’s where risk adjustment comes in. Risk adjustment uses statistical models to account for clinical risk factors that differ between patients. For example, an 85-year-old female undergoing cardiac surgery is more likely to suffer adverse outcomes compared to an otherwise healthy 50-year-old male undergoing the same procedure. Comparing the two patients as if they had the same level of risk would be misleading.
We have developed our own risk adjustment methodology, which we’ll discuss in more detail in the next section. In short, we run data through scientifically and clinically validated statistical models that explicitly evaluate all patient factors that may be related to each adverse outcome. Our modeling approach adheres to all of the best practices in risk adjustment, but with significantly improved efficiency.
Reliability adjustment is a statistical technique based on hierarchical modeling that was pioneered by the ArborMetrix founders [1] and is designed to isolate the signal and reduce the noise in large datasets.
When sample sizes for a hospital or clinician are small, it can be difficult to determine if outcomes such as mortality are due to chance or to true differences in quality. Traditional analytical methods often report outcome numbers that are misleading, because clinicians and hospitals can’t determine whether they are truly different from the average.
Additionally, statistical measures like confidence intervals and p-values are often misunderstood, ignored, or relegated to a footnote. This lack of accuracy can lead to care teams addressing problem areas that are, in reality, not problematic — leading to loss of time, effort, and expense.
To optimize the effort of quality improvement work, we provide reliability adjustment in addition to risk adjustment.
Together, these methodologies ensure patient outcomes and other performance metrics are reported accurately and with enough actionable clinical detail to effectively inform improvement efforts. Importantly, these methodologies are essential to building trust in the data.
Next, we’ll take a closer look at the methods used in both types of techniques, starting with risk adjustment.
Risk Adjustment Methods
ArborMetrix has developed a unique, best-in-practice risk adjustment methodology to significantly enhance analytic efficiency. In our methodology, registry data is run through scientifically and clinically validated statistical models that evaluate all patient factors that may be related to each outcome.
Additionally, we have introduced several innovations into our technology, such as real-time model recalibration, that automate the risk-adjustment process and ensure models are well-fit to changing data.
Let’s dive a bit deeper and explore the steps involved in developing a risk model.
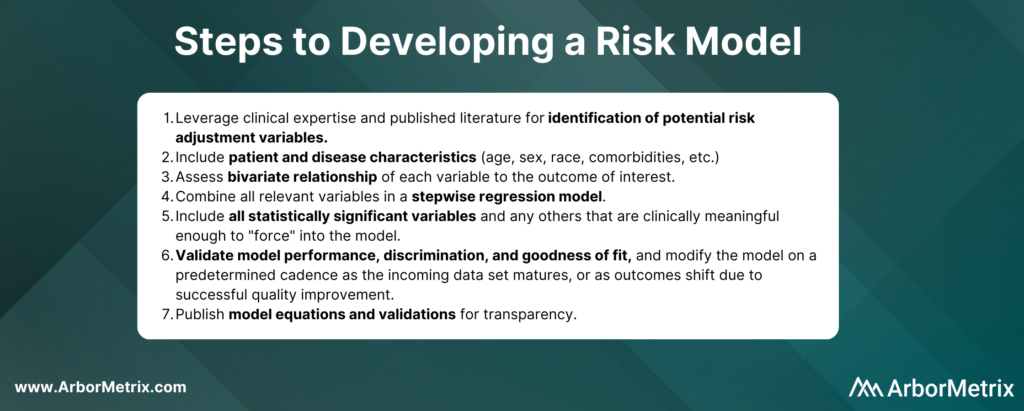
In practice, the specific risk factors included in the model will vary by outcome and by the patient populations included in the denominator for the measure. For example, some of the most important comorbidities in a risk model for serious complications of colectomy surgery include factors such as anemia, renal failure, and weight loss.
Risk adjustment corrects for the individual severity of patient illness within a dataset. With our highly efficient methodology, you can be sure that comparisons between clinicians, hospitals, or regions are accurate.
Reliability Adjustment Methods
Pioneered by our founders, reliability adjustment is a statistical technique based on hierarchical modeling that is designed to isolate the signal and reduce the noise in your dataset.
More specifically, when sample sizes for a hospital or clinician are small, the observed rates or rare outcomes may be due to chance and should be considered less precise than rates based on larger sample sizes.
What Is Reliability Adjustment?
Reliability is a measure of this imprecision, where a value of “0” means the outcome is 100% noise (completely unreliable) and a value of “1” means the outcome is 100% signal (perfectly reliable). In practice, most outcomes have reliability between 0 and 1.
Why Is Reliability Adjustment Important?
Reliability adjustment is important in certain circumstances because small sample sizes or rare outcomes create uncertainty for a hospital or clinician around whether differences in outcomes such as mortality were due to chance or true differences in quality.
For example, a hospital with a mortality rate of 50% because 1 patient died in a total of 2 cases should be interpreted very differently than if 100 out of 200 patients died. For most surgical procedures, they would need to have its mortality rate reliability-adjusted to account for the prediction that if they had 200 cases instead of 2, it would be very unlikely that their mortality rate would still be 50%.
We work with our registry partners through a methodical planning process to develop and refine clinically relevant and scientifically accurate reliability models.
Without reliability adjustment, traditional analytical methods often report outcome numbers that are misleading to clinicians and hospitals, who cannot sort out whether their performance rates are truly different from the average. Reliability adjustment helps clinicians and hospitals identify real problem areas and focus improvement activities where the greatest improvement opportunity exists.
In short, reliability adjustment corrects for random error, allowing you to trust that the analytic insights you’re generating are as accurate as possible.
MSQC Relies on Risk and Reliability Adjustment to Improve Performance
The Michigan Surgical Quality Collaborative (MSQC) is a national leader in surgical quality improvement. They help surgeons improve at the individual level by providing surgeon-specific reports to aid in performance self-assessment.
Risk adjustment is crucial to the hospital-to-hospital comparisons done routinely by MSQC, and the risk adjustment modeling and reporting development represent a combined effort between the MSQC analytic team and ArborMetrix. After the process of risk adjustment, the outcomes data is also reliability adjusted.
MSQC’s real-time, risk- and reliability-adjusted reports offer a look at each surgeon’s individual outcomes data, with a detailed drill-down on patient-level data included in the analysis. Surgeons can view their performance relative to their hospital or to the collaborative as a whole. Surgeons can also view their performance in comparison to other contributing surgeons, both within their institution and beyond, in a de-identified manner, providing even more valuable information to help surgeons identify areas for quality improvement.
MSQC is a top example of a clinical registry program that is achieving real-world quality improvement. Its members have collectively achieved outstanding results and greatly enhanced care for their patients. A few highlights include:
• 34% reduction in surgical site infection rates for colectomy procedures.
• 50% reduction in patient opioid consumption across 9 surgical procedures, with no changes to patient-reported satisfaction.
• 40% reduction in morbidity and mortality of non-trauma operations.
• Regularly published research in leading academic journals.
On-Demand Performance Feedback Makes Rapid Healthcare Improvements Possible
Having access to accurate, trusted analytical insights is helpful. Being able to act on those insights as quickly as possible is even better. That’s where on-demand performance feedback comes in.
ArborMetrix’s products deploy rigorous analytics, grounded in scientific best practices, allowing users to quickly and easily measure performance and understand their clinical outcomes and business. Our unique technology allows for reporting and the application of data science in real-time. This gives physicians access to up-to-date risk- and reliability-adjusted reporting, which builds trust and enables rapid-cycle improvements.
Traditional processes for producing reports with risk- and reliability-adjusted measures can take months using manual methods performed by statisticians. As a result, reports on comparative outcomes have traditionally been delivered in static formats that reflect old, stale data that may no longer be useful for quality improvement efforts.
With the interactive ArborMetrix platform, end-users can select different levels of aggregation, patient populations, and time periods to see dynamic risk- and reliability-adjusted reports that reflect the most up-to-date data. The combination of fresh data and flexible exploration of outcomes information means you can get useful feedback quickly.
Work With Data You and Others Can Trust
Together, risk adjustment, reliability adjustment, and on-demand performance feedback build trust in the data, which trickles down to trust in the evidence, trust in the insights, and trust in the conclusions drawn from the data. Further, having access to all of this information in real-time ensures that quality improvement efforts won’t go to waste.

Steps to Address Health Inequity: Awareness, Measurement, and Action

There are widespread, longstanding, systemic, and well-documented preventable health disparities among racial and ethnic minorities and amongst those in LGBTQIA+ communities. Minority populations experience a multiplicity of burden in regard to their health including poorer overall health statuses, worse outcomes, and disproportionate diagnosis of health conditions due to the intersection of structural inequity.
Barriers to access, differences in clinical need, and differences in patient treatment exacerbate these poorer health outcomes. Given this unfair burden, healthcare stakeholders have an ethical obligation to change healthcare delivery to address health inequity.
The Council of Medical Specialty Society (CMSS) provides a forum to catalyze healthcare improvements across U.S. medical specialty societies. They held the CMSS Leadership Summit on Equity and Antiracism in April 2021 to focus on methods to reduce health disparities, address issues perpetuated through dominant culture dynamics, and improve equity within medical specialties. Key objectives included:
- Increasing awareness of longstanding, health inequity and health disparities.
- Identifying and measuring disparities.
- Forming action to address disparities.
In this post, we share key learnings from the summit and expand on the role of clinical registries in this imperative work.
 Increasing Awareness of Health Inequity and Disparities
The initial step to increasing awareness around inequity and the role of bias in health disparities is acknowledging the extent to which these systematic processes harm health outcomes.
These processes permeate healthcare at every level: from the language we use to talk about racism and bias, to algorithms built on racist data that are used to perpetuate myths about genetic and physiologic differences between patients of different races [1], to the exclusion of minorities in medical schools, to the lack of provider diversity, and ultimately in patient care.
This work begins with the way we speak about bias in general, and racism specifically. The language used to describe processes that exclude people who do not conform to dominant sociocultural norms indemnifies the very groups that perpetuate these processes. [2] This camouflages how detrimental bias is to both wealth-building and health outcomes. In changing how we talk about persons that do not hold power and influence in society, firstly we recognize that there is a difference in treatment based on power dynamics and we open the door to changing that dynamic.
Increasing awareness must be a systematic process occurring at every level of healthcare. This begins with recognizing race as a social construct that has physical implications [3] and treating social data with the same gravity as traditional medical data and enacting policy to support the collection and bidirectional transfer of these data. It also includes creating psychologically safe environments that encourage allyship amongst clinicians of dominant sociocultural groups and marginalized people. [4]
To dismantle racism and bias within healthcare, we must prioritize diverse perspectives amongst clinicians and the healthcare delivery system as a whole and normalize diversity, equity and inclusion initiatives. [5] To increase awareness surrounding health inequity, we are educating and training our team, focusing on ways to integrate the use of social data in registries, and supporting our clients in doing the same. We are also developing partnerships with and learning from experts who can help accelerate our work in measuring and improving health equity so that we can in turn support organizations like CMSS.
Identifying and Measuring Healthcare Disparities
Advancing health equity work in the pursuit of reducing and eliminating health disparities involves detection and measurement in addition to understanding the determinants. Clinical data registries can be instrumental in these tasks by assessing the causes and impact of health disparities on patient outcomes.
According to the Centers for Disease Control and Prevention (CDC), only 10 percent of factors affecting premature death are related to clinical care, and 30 percent of factors relate to genetics. This means that 60 percent of factors impacting premature death are based on a combination of social/environmental factors (20 percent) and behavior (40 percent). Ensuring the delivery of high-quality, patient-centered care requires understanding both the needs and circumstances of the populations served. Registries can collect and analyze patient, clinical, social, and geographic data to provide a more complete view of the type of advantages or disadvantages certain patients have in attempting to achieve optimal health. [6]
Fully identifying and measuring disparities and their root causes necessitates data that goes beyond clinical data elements. This includes the prioritization and comprehensive collection of social data such as:
- ICD-10-CM codes (Z55-Z65) that detail patient social risk factors
- Utilizing public health datasets such as the American Community Survey, Behavioral Risk Factor Surveillance System and CDC National Vital Statistics System
- Patient-reported outcomes data
Integrating comprehensive social data elements in the United States Core Data for Interoperability (USCDI) and enforcing mandatory collection within electronic health records (EHRs) are two steps that make up a meaningful process in measuring the extent and impact of social determinants of health.
Forming Action to Address Healthcare Disparities
Data and measurement are only as valuable as it is usable and actionable. Advancing health equity begins with understanding the sources of disparities, but it can only be achieved through effective action.
Once disparities are assessed and the causes are understood, impactful interventions can be developed using data-driven approaches.
However, implementing informed interventions is only the first step. Next, interventions must be evaluated for effectiveness, changed to address problems as necessary, and finally, best practices must be disseminated to scale.
Leveraging Clinical Registries to Improve Health Equity
To promote optimal patient care, it is our ethical obligation to understand the prevalence and severity of social and health inequities, utilize comprehensive data collection and analysis, and take informed action to end them. We must evaluate and implement interventions that effectively improve outcomes for the most vulnerable populations, which in turn improves conditions for all populations.
Clinical data registries are valuable tools for pursuing these efforts. Registries can collect a high-volume of data from different sources and deliver high-quality, data-driven insights. Reduction and eventually elimination of health disparities require data to detect and measure impact, identify the complex and interconnected determinants, and inform interventions and best practices.

The Top Takeaways From the 2021 ONC Annual Meeting: Actionable Data as the Great Equalizer

The Office of the National Coordinator for Health IT (ONC) held its first fully virtual annual meeting last month with a focus on utilizing healthcare information technology and data to strengthen the United States healthcare system, address patient needs, and improve outcomes.
The U.S. Department of Health and Human Services (HHS) – the entity over both the Centers for Medicare and Medicaid Services (CMS) and the Centers for Disease Control (CDC) – and ONC have successfully aligned priorities according to their strategic plan for 2018-2022. [1] Included in this plan are the following goals:
- Reform, strengthen, and modernize the nation’s healthcare system.
- Protect the health of Americans where they live, learn, work, and play.
- Strengthen the economic and social well-being of Americans across the lifespan.
- Foster sound, sustained advances in the sciences.
- Promote effective and efficient management and stewardship.
This year’s conference sought to fine tune national priorities, viewing them through the lens of COVID-19 and health inequality. The conference addressed HHS goals through the following six themes:
- Leveraging healthcare information technology to address inequities and social determinants of health.
- Propelling standards use in healthcare IT to improve interoperability of health data and address new data collection modalities.
- Modernizing healthcare data collection to drive research and innovation.
- The importance of using regulation and policy to support healthcare IT infrastructure.
- Using health IT in public health emergencies.
- Reducing clinician burden through the use of health IT.
 Addressing some of the greatest challenges in health means using the most innovative technology to advance care and improve outcomes.
While the current health IT ecosystem is surrounded by complexity and compartmentalization, new standards and technologies are creating a solid backbone to unlock greater potential impact. Organizations such as medical specialty societies can bring together diverse healthcare stakeholders to use technology and data science to collect and analyze data and advance health.
This work becomes increasingly more efficient and valuable when it is supported by technology that is aligned with the innovative standards showcased by the ONC.
Leveraging Healthcare Information Technology and Using Social Determinants of Health Data to Address Inequities
The adage that “you can’t fix what you don’t measure,” is crucial to health information technology’s role in fixing social inequity in healthcare.
Social data is exceedingly responsible for health outcomes and healthfulness. Research has shown that genetics are accountable for approximately 20 to 30% of health outcomes and medical care attributable to about 10 to 20%. This leaves roughly 70% of health outcomes attributable to behavior and social determinants of health. [2]
A person’s ZIP code is the most dominant factor in determining health. It determines access to care, access to fresh and healthy food, environmental risk, and it ultimately determines life expectancy. Now, it also means having access to information through technological innovations such as broadband internet. This has been magnified during the COVID-19 pandemic, with at-risk populations unable to access appropriate information to get the care they need.
Currently, there is a divide between health data and community needs. Until now, health information technology has disregarded its role in perpetuating systemic inequality. Often social data such as class, race, rurality, and language are missing from the electronic health record (EHRs). These data have been either not measured correctly or ignored, contributing to adverse health outcomes in poor, rural, and minority communities.
Unreliable sources of social data coupled with the lack of centralization and standardization of data constrain accuracy. This leads to underserving vulnerable populations. However, the COVID-19 pandemic and the current social justice movement is creating a paradigm shift in the way race, class, and health are being examined and addressed.
Healthcare information technology has the ability to set the stage for creating an equitable health environment and can do so in four key focus areas:
- Incorporating standards through FHIR and nonproprietary open APIs.
- IT infrastructure through health information exchanges and widespread broadband access.
- Public health policy and funding for digital transformation and interoperability.
- Implementation of practices to promote health equity.
Promoting the collection and use of social data and using it to predict and rectify adverse health outcomes are necessary to drive change.
Historically, we have looked to electronic health records to be the primary information source for health data. These systems are transactional in nature and do not serve as the complex fusion network of data needed to address complex societal problems.
Moving forward, data must be pulled dynamically from different sources to adeptly address changing social needs. Healthcare IT can both challenge and change health inequity through thoughtful collection of data beyond the electronic health record. Data collection systems should incorporate “heath equity by design,” where mechanisms to achieve equity are engineered into systems for collecting and transforming health information.
Ultimately, the health consumer must be central to all innovation in health information technology. Social health information exchange can leverage existing infrastructure and integrate social determinants of health tools and applications to make social health data both available and interoperable. Funding for digital transformation, state block grants for interoperability, federal information consent privacy rules that are aligned with the needs of vulnerable populations are all necessary for achieving health equity by design.
Using Health IT in Public Health Emergencies
The COVID-19 pandemic has demonstrated the fragility of our healthcare system and has forced all aspects of healthcare, including health information technology, to revolutionize under duress. The past year has pointed out our lack of a standard, scalable case-based surveillance system that allows us to adapt to new widespread threats such as COVID-19.
Currently, electronic health records do not have the capability to incorporate data from alternate data sources such as pathogen diagnostics systems. This was a hindrance in surveillance for COVID-19.
Relying primarily on the EHR for health data limits our ability to respond to threats with agility. The pandemic has taught us that much of healthcare takes place in nontraditional spaces, and our information systems must adapt to this.
COVID-19 testing and vaccination occurs in a myriad of facilities outside of traditional healthcare spaces and we miss out on valuable data because we do not have the ability to collect information from these sources. Furthermore, people who are treated in these nontraditional spaces are typically people who suffer most from health inequities.
Propelling Standards Use in Healthcare IT to Improve Interoperability of Health Data and Address New Data Collection Modalities
The 21st Century Cures Act (Cures Act) was initially set to go in effect in 2020, but the COVID-19 pandemic took precedence and has delayed implementation until now. This groundbreaking regulation provides an opportunity to demystify myths surrounding interoperability and make data liquidity a priority within healthcare.
In a Stanford poll of primary care physicians, 67% indicated that they would like to see interoperability and system-wide information sharing be addressed as the most pressing healthcare issue we face in the next decade. [3]
Significant challenges lie in making health data completely interoperable. While we may focus on the creation of electronic data standards, the adoption of electronic modalities of collecting and transferring data have not reached complete saturation. Standards must incorporate all modalities and address settings where there is not wide adoption of EHRs such as in rural settings. While there is emphasis on electronic data collection, standards should be applicable to analog forms of data collection, as well.
Integration of social determinants of health data, device and mobile data, and traditional patient data from EHRs is fundamental to propelling our healthcare system into the future. Without integration, there is significant financial and human life cost to patients in the way of lack of access to care, needless repeated diagnostic care and inappropriate care. Standards will promote integration and bi-directional data exchange, allowing a deeper understanding of the continuum of patient care.
Modernizing Healthcare Data Collection to Drive Research and Innovation
Electronic health record systems primarily serve as a container for health data, rather than a tool for improving health and healthcare.
All levels of healthcare, including local and national levels, struggle to obtain timely, accurate, and actionable data from electronic health records. The current structure for data collection and exchange requires clinicians to spend less time with patients and more time interfacing with electronic systems that were not purpose-built, which results in omissions and errors. The structure is not scalable without significant resources and effort.
This mismatch between need and function fosters delays and a loss of data precision, a loss of trust amongst providers, and creates an unsustainable system at increased cost. Current healthcare data infrastructure is reactive, siloed and inefficient. To respond to future threats, the infrastructure must be transformed into a system that is predictive, agile, and focused on sharing and understanding timely data and resources.
To overcome these barriers, health agencies such as the CDC and other partners are looking to utilize API gateways to support streamlined, coordinated, and interoperable public health reporting. Ongoing modernization includes leveraging cutting-edge analytics and data visualization capabilities to seamlessly integrate data from disparate sources.
Health data is increasingly being generated by sources other than patient visits and electronic health records. With the advent of personal health devices such as continuous glucose monitors and fitness wearables, patients are increasingly creating and monitoring their own health data. By 2025, there will be over 180 billion gigabytes of sensor data generated by Internet of Things devices, much of this data related to health and fitness. [4, 5]
As the technology for these devices matures, this data has far-reaching implications for healthcare, including remotely monitored condition management, chronic condition self-management, faster diagnosis, earlier interventions and medication compliance. Incorporation of sensor data in healthcare can potentially streamline resource use, increase quality and lower cost.
The COVID-19 pandemic created an increase in telehealth visits. Having remote access to diagnostic sensor data will transform the utility of telehealth, creating the ability to easily provide care in rural and nontraditional settings.
Currently, most sensor data do not adhere to standards-based protocols and unless the data is unified and interoperable, it will continue to create vertical silos which creates superfluous complexity in data flow. [5] Sensor data will be of limited utility and is unlikely to reach the saturation needed to be viable unless standards-based interoperability is built in from the start.
While technological innovation is important to modernizing healthcare data collection, it cannot be done without a robust public health workforce. In addition to making data interoperable, we must focus on reskilling and retaining a vigorous data science workforce including public health informaticists to carry out 21st Century public health work. This requires significant funding and investment into public health human resources.
The Importance of Using Regulation and Policy to Support Healthcare IT Infrastructure
Policy and regulation can be drivers of public health change at the local, state, and national level.
The Cures Act lowers the barrier for data liquidity through information blocking provisions, availability of nonproprietary APIs, support of bi-directional data exchange for data flow amongst multiple entities, and transparency for patients through the Trusted Exchange Framework and Common Agreement (TEFCA). TEFCA outlines conditions to be met to promote secure exchange between providers, health information networks (HINs), and patients. This puts the patient at the center of healthcare IT and promotes ownership and patient management of data.
Required implementation of secure, standards-based application programming interfaces (APIs) by providers will make patient data readily available to aid in making timely decisions about patient care. This can be leveraged to power clinical decision support tools such as CDS Hooks that work in real-time to support clinician workflow.
The Information blocking provision in the 21st Century Cures Act prohibits health IT developers of certified health IT, health information networks, health information exchanges, and health care providers from engaging in practices that interfere with access, exchange or use of electronic health information. These provisions promote patient-centered care and allow patients greater access to their own health data and prohibits providers and health information technology developers from holding data ransom for financial or personal gain.
Lastly, new office and outpatient evaluation and management (E/M) coding and guideline changes improve clinician workflow, infrastructure and ultimately patient experience by reducing administrative burden of documentation. [6] The streamlining of coding and documentation requirements for evaluation and management codes and elimination of “documentation for the sake of documentation” will lead to payment for patient visits being resource-based rather than time-based.
Ultimately, policy is necessary to drive standard, widespread change across healthcare. Regulation has the power to drive data integration, a fundamental need to the health of this country. Proprietary systems have reason to remain siloed to protect economic interests and are unlikely to change unless forced.
While there have been significant improvements with the advent of the Cures Act and other guideline changes, additional work is needed to create national frameworks and best practices for choosing and implementing healthcare IT. Currently, the process for selecting IT is highly fragmented, and organizations rely on data that does not meet public health needs. This leads to increased cost and decreased functionality at the expense of patient care.
Reducing Clinician Burden Through the Use of Health IT
According to the same Stanford poll previously referenced, roughly 70% of primary care clinicians state that despair and burnout are at an all-time high and the current healthcare IT infrastructure contributes to this. [3]
Clinician burden is realized in the amount of time spent on activities that are not direct patient care. Clinicians regularly voice their concerns about administrative burden by describing laborious overdocumentation “note bloat” and poorly structured electronic health record systems, nicknamed “five clicks to crazy.” These inefficient systems harm clinicians and patients alike as more time is spent managing the process of healthcare rather than providing healthcare.
When the technology revolution finally reached healthcare, it was intended to streamline processes and allow clinicians to spend more time with patients. While electronic health records have been demonized as the root of all evil in clinician burnout and medical errors due to missing or erroneous information [7], it is well documented that the same administrative burden occurred in paper-based healthcare administration [8]. Instead of utilizing healthcare IT to transform healthcare, we simply traded the fragmented, broken system of paper for a fragmented, broken system of mouse clicks.
Clinician experience can be improved through the new E/M guidelines that reduce the documentation needed for a patient visit. But there are technological innovations that can increase efficiency, reduce the amount of time spent documenting patient information, and improve health outcomes such as using note dictation and workflow automation principles such as natural language processing, robotics, and, machine learning.
Healthcare presents a complex management task, and workflow automation can streamline repetitive processes, enabling high-quality, safe, secure, and effective patient-centered care. Automation of rote tasks can reduce errors and decision-making burden. This allows clinicians to devote their time to specialized patient care and allows greater engagement for decision support. This requires standards adherence since automation requires repetition, clearly defined variables for modeling and clear roles and responsibilities for actors.
ONC is preparing its policy and development agenda on modern computing and is committed to supporting clinicians through standards and processes, such as workflow automation. To reduce burden for all and produce high-quality healthcare, these processes must preserve the following:
- Measurable goals
- Involvement of stakeholders in design
- Preservation of human judgment
- Avoidance of adverse outcomes
- Scalable approaches across settings
- Incorporation systems for reducing health inequity
- Improved efficiency, savings, and quality
Actionable Data as the Great Equalizer
We need comprehensive, interoperable data to strengthen the nation’s healthcare system, to reduce inequity, and improve health outcomes. This is only possible through a complex fusion network of data and meaningful analytics.
As a healthcare analytics organization, we embrace and drive adoption of standards and technologies that make research and quality improvement accessible and successful. We support the vision of making actionable data the great equalizer through creating fusion networks of registry data that identify improvement opportunities, investigate what is driving outcomes, and promote future forecasting through advanced predictive modeling.
Together, we can create the healthcare system of the future by creating interoperable networks of actionable data.